Exports & Reports
This page explains how exports work in the current desktop UI. Exports are focused on capturing live or playback data (frames, charts, and logs) so you can share results or archive a run. The desktop app does not include a separate report builder panel, so exports are the primary way to package evidence.
Where Exports Live
Exports are started from the panel you are using. Each export action opens a save dialog so you can choose the destination and filename. If you are working on a team, use a shared folder so others can open the output quickly.
File Menu Export
The File menu exposes the top-level export entry so you can access it without hunting for a panel button.
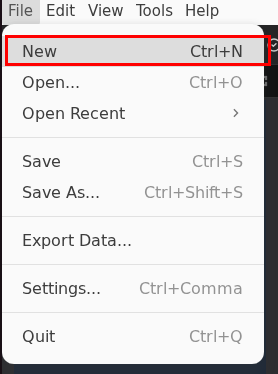
Use this path when you want a general export action but are not sure which panel owns the data you need. If you are already working in a specific panel, use its Export button instead.
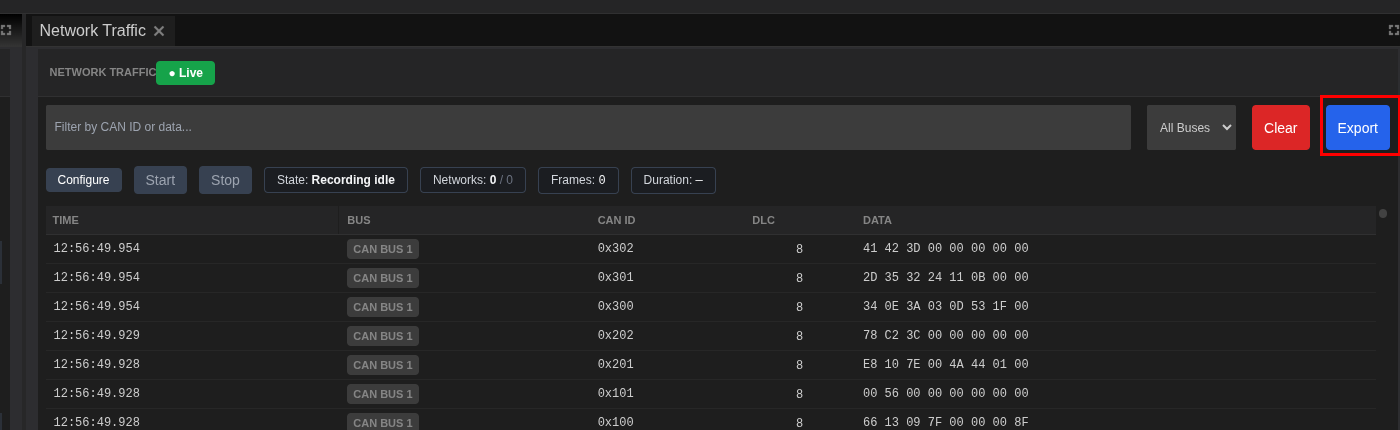
Network Traffic Export
The Network Traffic panel is the canonical place to export raw frames. It shows the live CAN stream and includes an Export button in the panel header.
Common use cases:
- Capture a live run while the system is running.
- Share a filtered view after narrowing by CAN ID or data pattern.
- Archive a short test without exporting the full dataset.
Typical workflow:
- Start your system so traffic is flowing.
- Apply filters if you only need a subset of frames.
- Click Export in the Network Traffic panel.
- Choose a filename and destination folder.
- Save and verify the exported file in your OS file browser.
If you are not seeing frames, confirm the correct bus is selected and reminds you that traffic only appears when the system is running.
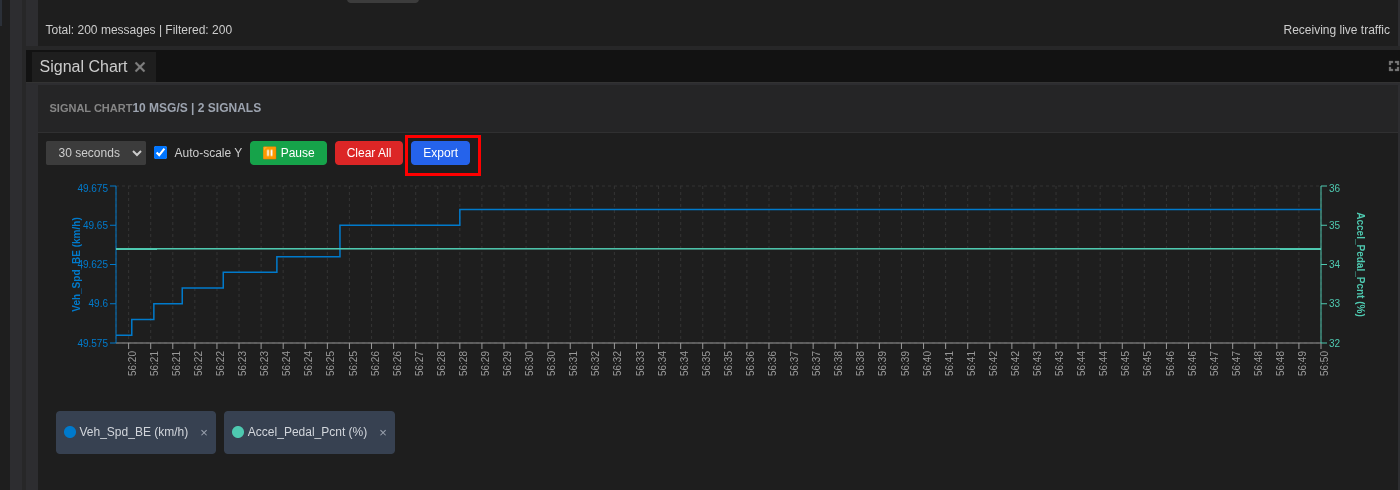
Signal Chart Export
The Signal Chart panel lets you export the plotted view of selected signals. This is ideal for sharing a trend or a behavior snapshot.
Best practices:
- Select signals first in the Signal Viewer so the chart contains meaningful series.
- Set the time window to keep the chart readable.
- Pause the chart before export if you want a stable capture.
Use chart exports when you need a quick visual for a report, slide deck, or a ticket update.
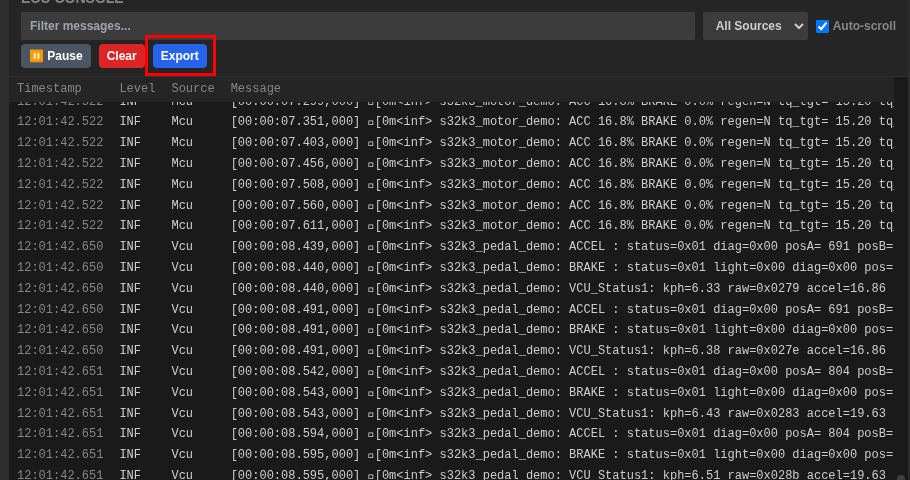
ECU Console Export
The ECU Console panel includes an Export button for log capture. This is useful when diagnosing startup problems or runtime errors.
Recommended flow:
- Filter the console to the ECU or keyword you care about.
- Pause if needed so the log view stops scrolling.
- Click Export and save the log file.
Log exports provide a lightweight record of what happened during a run and are often requested by support teams.
Tips for Reliable Exports
- Name files clearly with system name, date, and purpose (for example:
drive-cycle-2025-01-05-can-traffic.csv). - Keep filters visible so it is obvious what is included in the export.
- Export in smaller chunks when troubleshooting to avoid huge files.
- Store exports with the system so the context is preserved.
Troubleshooting
| Issue | Suggested Fix |
|---|---|
| Export button disabled | Start the system and confirm the panel is receiving data. |
| Empty export | Clear filters or choose the correct bus before exporting. |
| Export not found | Re-run export and note the destination folder in the save dialog. |
| Logs incomplete | Pause the console before exporting to capture a stable range. |