System Design Workflow Tutorial
This comprehensive tutorial guides you through the complete process of designing, configuring, and deploying a multi-ECU automotive system in TrueFidelity Desktop. You'll learn how to create a realistic ECU network topology, configure hardware settings, build firmware, and monitor running systems in real-time.
Overview
Goal: Build a complete automotive drive cycle simulation system with multiple ECUs connected via CAN bus, configure their properties, deploy them as Docker containers, and monitor their real-time execution using TrueFidelity's comprehensive monitoring tools.
What You'll Learn:
- Creating and organizing system projects in TrueFidelity
- Building ECU network topologies using the visual System Canvas
- Configuring ECU hardware and software properties
- Understanding the relationship between ECUs and Network buses
- Deploying ECU containers and managing their lifecycle
- Monitoring system performance and debugging issues
- Exporting configurations for team collaboration
Time estimate: 20-30 minutes for complete walkthrough
Prerequisites:
- TrueFidelity Desktop installed and license activated
- Docker Desktop running and accessible
- Basic understanding of automotive ECU concepts
- ECU firmware binaries for deployment
Step 1: Create a New System
Let's begin by creating a new TrueFidelity system project. This will be the container for all your ECUs, networks, and configurations.
- Launch TrueFidelity Desktop
- Wait for the application to fully load
-
You should see the welcome screen or an empty workspace
-
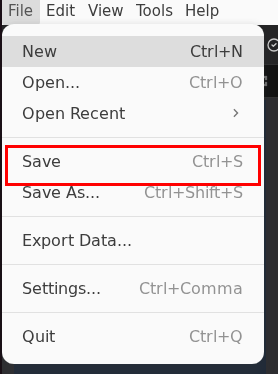
Create a new system project using the File menu
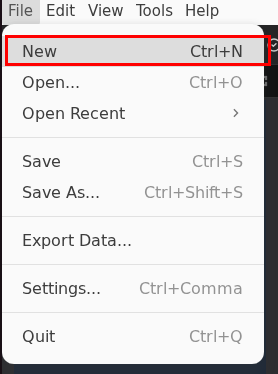
- Navigate to File → New in the menu bar
- Alternatively, use the keyboard shortcut
Ctrl+N(Windows/Linux) orCmd+N(macOS)
- Configure your new system in the New System dialog:
- System name: Enter
Drive Cycle- this will be your project identifier - Description (optional): Add "Electric vehicle drive cycle simulation with pedal inputs and motor control"
- Save location: Click Browse and select your projects folder (e.g.,
~/Documents/TrueFidelity/Projects) - Leave other settings at their defaults for now
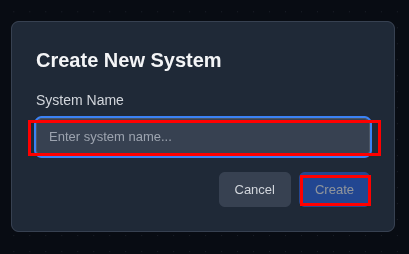
- Click Create to generate your system
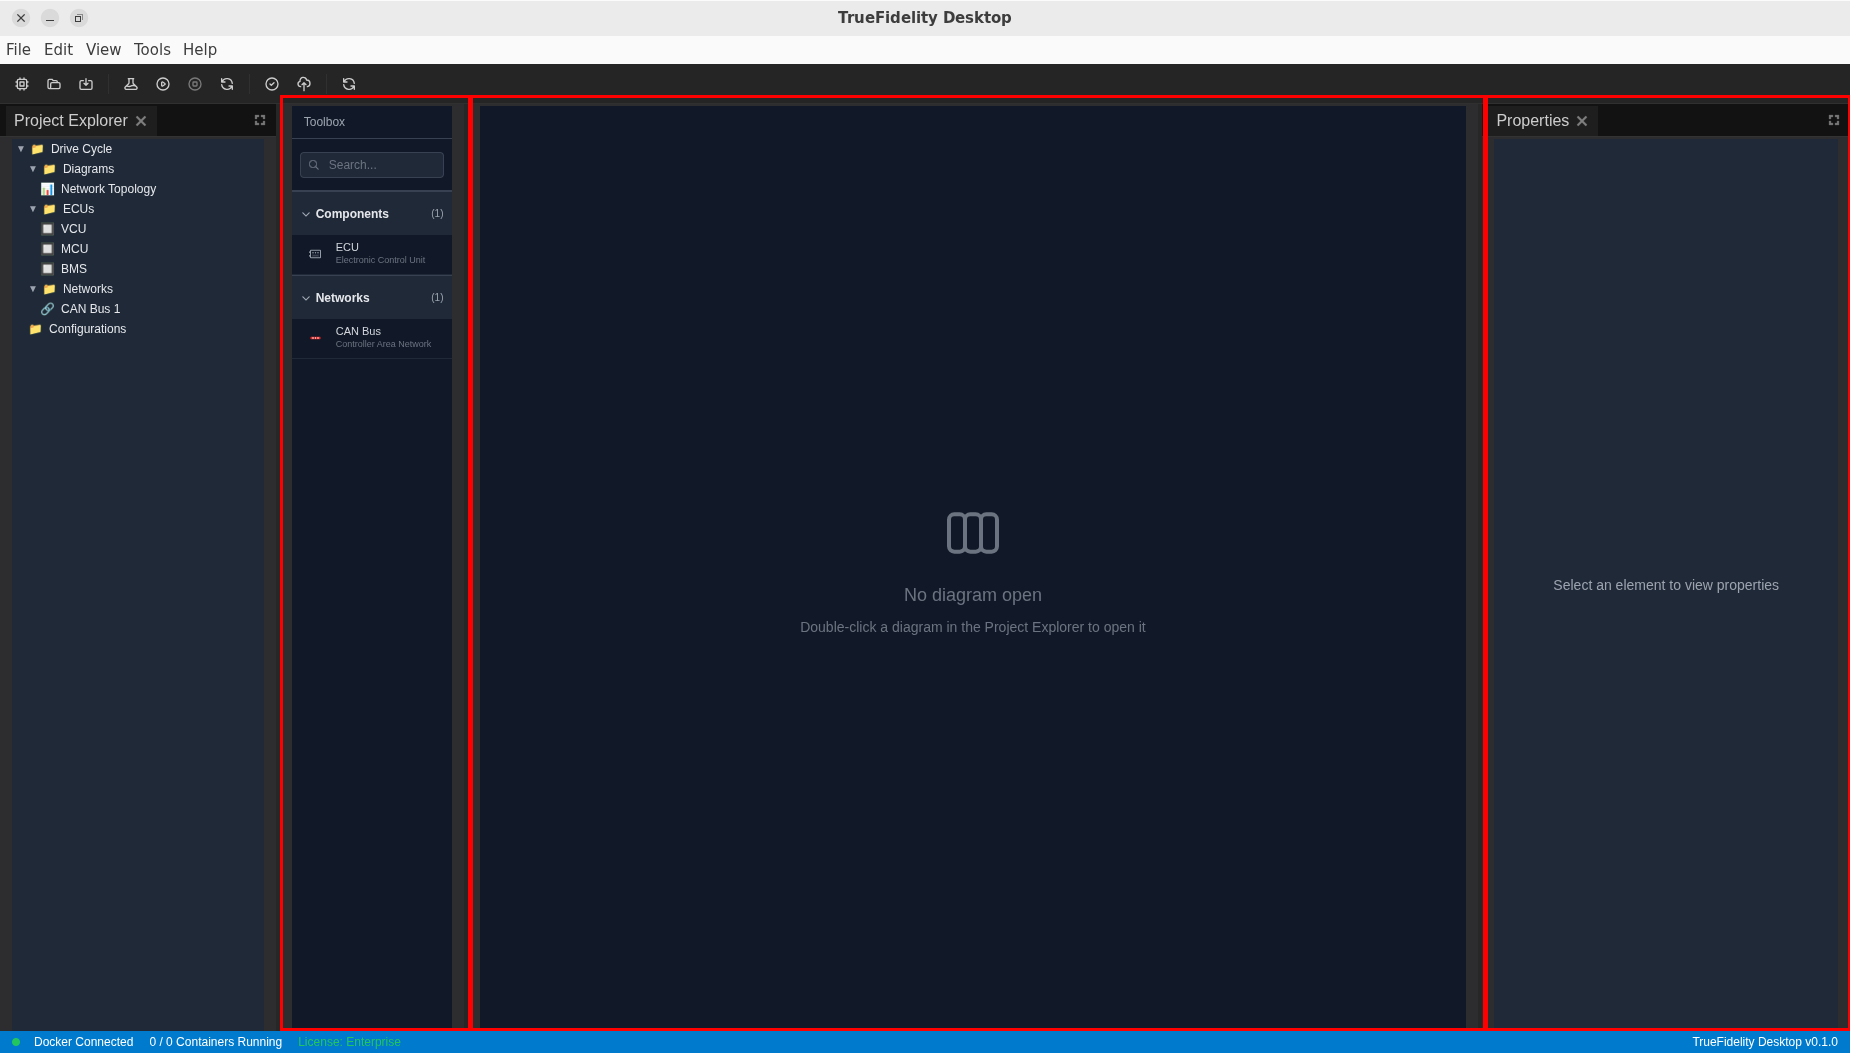
After creation, TrueFidelity automatically opens the System Design workspace. You'll see three main areas:
- Left panel: Toolbox containing draggable components
- Center: System Canvas (currently empty) where you'll build your topology
- Right panel: Properties panel for configuring selected elements
Understanding the Workspace
The System Design mode is specifically optimized for creating ECU topologies. The layout is inspired by professional CAD tools, with a component library on the left, workspace in the center, and properties on the right. This arrangement allows for efficient drag-and-drop system design.
Panel Management
If any panels are missing, you can restore them via View → Panels menu. The Toolbox is essential for this tutorial - ensure it's visible before proceeding.
Step 2: Add ECUs to the Canvas
Now we'll add Electronic Control Units (ECUs) to build our automotive system. ECUs are the computational nodes that will run your firmware and communicate over the network.
Understanding the Toolbox
- Locate the Toolbox panel on the left side of the screen
- It contains two main categories: Components and Networks
- Each category can be expanded to show available items
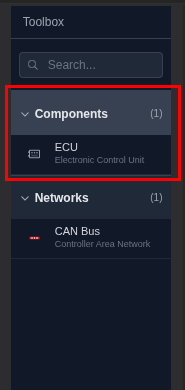
- Expand the Components category by clicking the arrow next to "Components (1)"
- You'll see "ECU - Electronic Control Unit" listed
- This is a generic ECU template that can be configured for different purposes
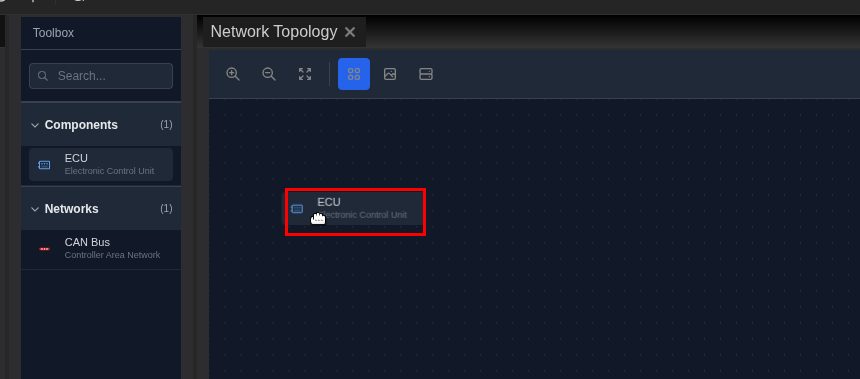
Adding Your First ECU
- Add a VCU (Vehicle Control Unit) to the canvas:
- Click and hold on the "ECU" item in the Toolbox
- Drag it onto the empty canvas area
- Release the mouse button to place the ECU
- The ECU appears as a UML-style component box with the label "«ECU»"
- Position the VCU in the upper-left area of the canvas
- Click on the ECU to select it (you'll see blue selection handles)
- The ECU label will initially show a generic name
- We'll configure its specific properties in the next step
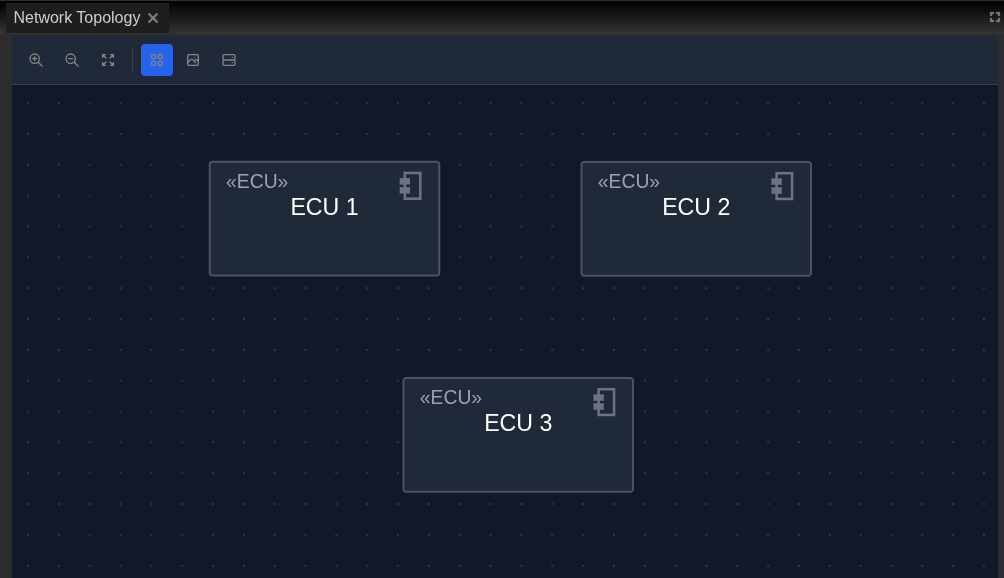
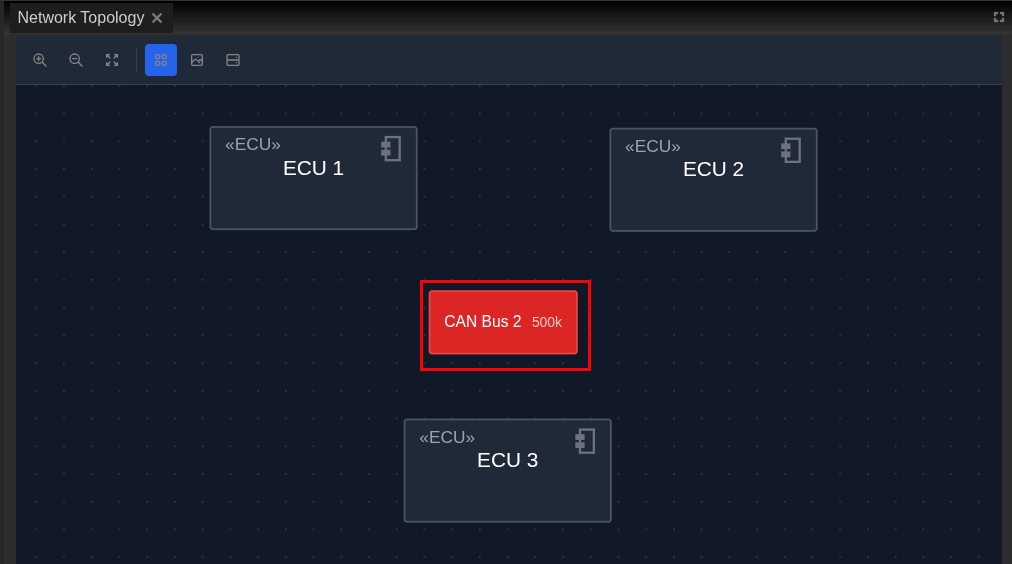
Adding Additional ECUs
- Add two more ECUs for a complete system:
- Drag another ECU from the Toolbox and place it in the upper-right area
- This will be your MCU (Motor Control Unit)
- Drag a third ECU and place it in the lower area
- This will be your BMS (Battery Management System)
Your canvas should now display three ECU nodes:
Canvas Navigation
- Zoom: Use your mouse wheel or the zoom controls in the toolbar
- Pan: Hold right-click and drag, or use middle mouse button
- Select: Left-click on any element
- Multi-select: Hold Ctrl/Cmd and click multiple elements
- Grid snap: Elements automatically align to the grid for neat layouts
ECU Visualization
ECUs are displayed using UML component notation (rectangular boxes with small squares on the side). This is a standard representation familiar to automotive engineers. The gray color indicates they're not yet configured or running.
Step 3: Configure ECU Properties
Each ECU needs to be configured with hardware specifications, software settings, and firmware options. Let's start with the VCU.
Configuring the VCU (Vehicle Control Unit)
- Select the VCU by clicking on it
- The ECU will show blue selection handles around its border
- The Properties panel on the right automatically updates to show ECU settings

- Review the Properties Panel structure on the right side:
- GENERAL section: Basic identification (Name, ID)
- HARDWARE section: Board selection, memory, and flash settings
- SOFTWARE section: Operating system and firmware configuration
-
DEBUG section: Development and debugging options
-
Configure the VCU properties:
GENERAL Settings:
- Name: Change from default to
VCU - ID: Automatically generated (e.g.,
ecu-1763540145789) - leave as is
HARDWARE Settings:
- Board: Select
S32K3X4EVBfrom the dropdown - Memory: Enter
16MB(appropriate for Zephyr-based MCUs) - Flash: Enter
2MBfor flash storage
SOFTWARE Settings:
- Operating System: Select
Zephyrfrom the dropdown - Firmware Mode: Choose between:
- Binary File: Use a pre-compiled firmware binary (.elf, .bin, .hex)
- Source Code: Build from source using TrueFidelity's build system
- For this tutorial, select Binary File mode
- Firmware Binary: Click "Browse" to select a firmware file
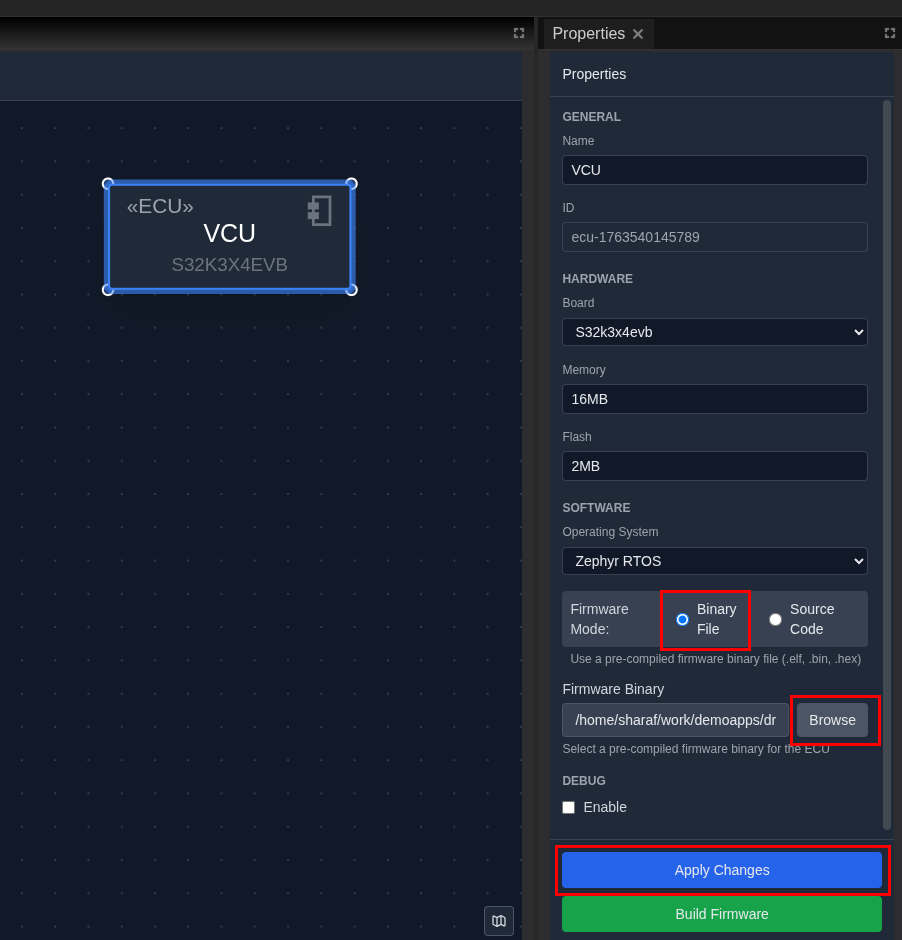
- Click "Apply Changes" button at the bottom of the Properties panel
- This saves your configuration to the ECU node
- The ECU label updates to show "VCU" and the board type
Configuring the MCU (Motor Control Unit)
- Select the MCU (upper-right node) and configure:
- Name:
MCU - Board:
S32K3X4EVB(same board family as VCU) - Memory:
16MB - Flash:
2MB - Operating System:
Zephyr - Firmware Mode: Binary File
- Click Apply Changes
Configuring the BMS (Battery Management System)
- Select the BMS (lower node) and configure:
- Name:
BMS - Board:
S32K3X4EVB(same board family) - Memory:
16MB - Flash:
2MB - Operating System:
Zephyr - Firmware Mode: Binary File
- Click Apply Changes
After configuration, your ECUs will display their names and board types on the canvas.
Hardware Board Selection
TrueFidelity supports various automotive development boards including: - S32G274A: High-performance processors for gateway applications - S32K3X4: General-purpose automotive MCUs for body and powertrain - IMX8: Application processors for infotainment - Custom boards can be added through configuration files
Firmware Options
- Binary File Mode: Quick deployment using pre-built binaries
- Source Code Mode: Full build integration with TrueFidelity's build system
- The "Build Firmware" button (green) becomes active when source code mode is selected
Step 4: Add Network Bus and Create Connections
In TrueFidelity, networks are represented as separate bus nodes that ECUs connect to, accurately modeling real automotive architectures where multiple ECUs share a common communication bus.
Understanding Network Architecture
Before we proceed, it's important to understand how automotive networks work:
- ECUs don't connect directly to each other
- Instead, they connect to shared network buses (CAN, LIN, Ethernet, FlexRay)
- Multiple ECUs can connect to the same bus
- Messages broadcast on the bus are visible to all connected ECUs
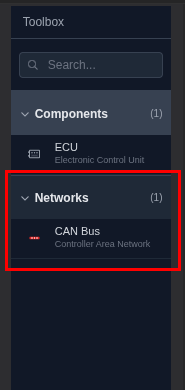
Adding a CAN Bus
- Expand the Networks category in the Toolbox
- Click the arrow next to "Networks (1)"
- You'll see "CAN Bus - Controller Area Network" listed
- Drag a CAN Bus onto the canvas:
- Click and hold on "CAN Bus" in the Toolbox
- Drag it to the center area between your three ECUs
- Release to place the network bus
- The CAN bus appears as a red horizontal bar (red is the standard color for CAN)
- Position the CAN Bus centrally:
- Place it roughly in the middle of your three ECUs
- The bus can be resized by dragging its edges if needed
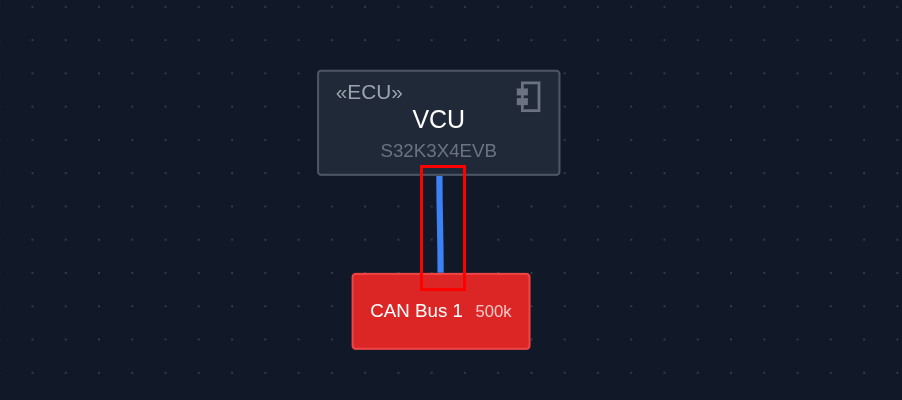
Connecting ECUs to the Network
- Connect the VCU to the CAN Bus:
- Hover over the VCU - you'll see small blue connection handles appear
- Click and drag from one of the handles
- Drag the connection line to the CAN bus
- Release when the bus highlights, indicating a valid connection
- A blue connection line appears between the ECU and the bus
- Connect the remaining ECUs:
- Connect the MCU to the same CAN bus using the same drag technique
- Connect the BMS to the CAN bus
- All three ECUs are now on the same network
Your system should now show all three ECUs connected to a central CAN bus:
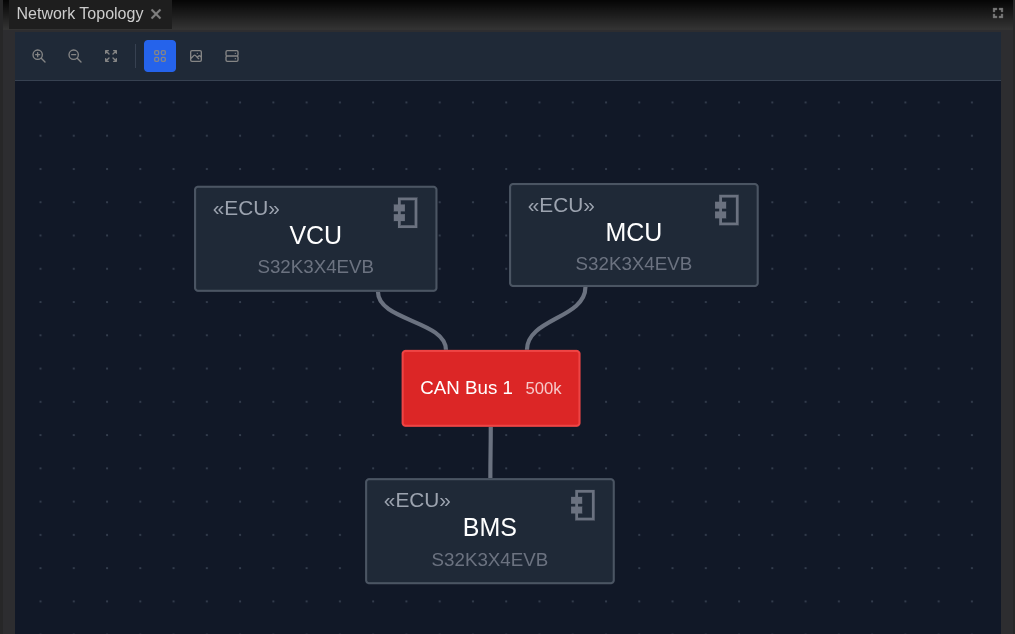
Understanding Network Visualization
Notice the visual elements:
- CAN Bus: Displayed as a red horizontal bar with "CAN Bus 1" label
- Baud rate: Shows "500k" indicating 500,000 bits per second
- Connection lines: Blue lines from ECUs to the bus
- Connection handles: Small circles that appear on hover for creating connections
Step 5: Configure Network Properties
Now let's configure the CAN bus parameters to match your system requirements.
- Select the CAN Bus by clicking on the red network bar
- The bus will show selection highlights
- The Properties panel updates to show network configuration
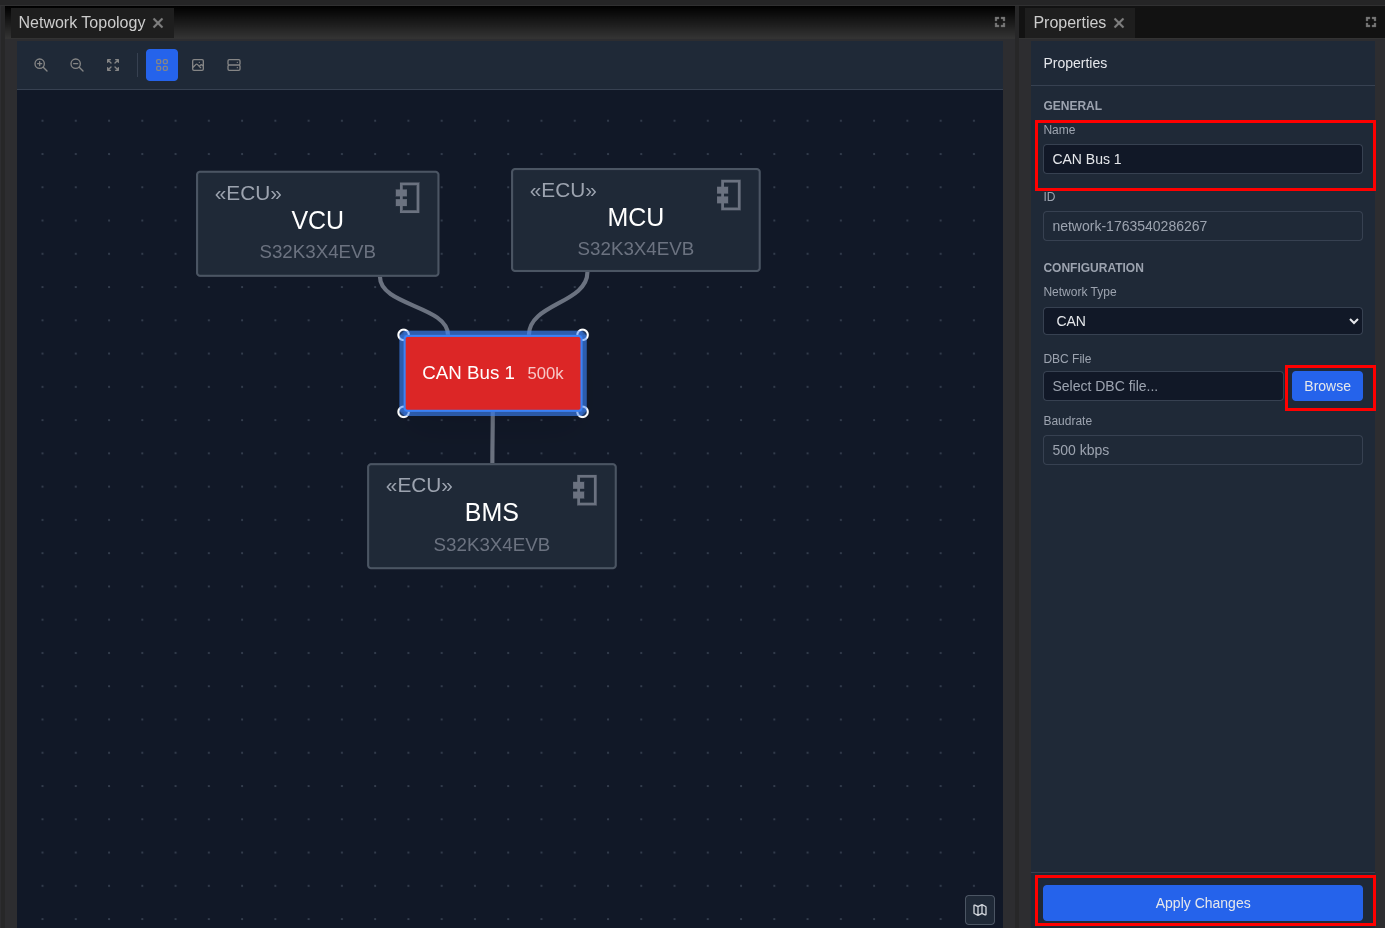
- Configure network settings in the Properties Panel:
GENERAL Settings:
- Name: Keep as "CAN Bus 1" or rename to "Main CAN"
- ID: Auto-generated network identifier
CONFIGURATION Settings:
- Network Type: CAN (already set)
- Baud Rate:
500000(500 kbps - standard for powertrain) - Channel:
can0(the Linux network interface name) -
DBC File: (Optional) Browse to select a DBC database file for signal definitions
-
Apply the configuration:
- Click Apply Changes to save the network settings
- The bus label updates to show the baud rate
Common CAN Baud Rates
- 125 kbps: Low-speed body electronics
- 250 kbps: General body control
- 500 kbps: Powertrain and chassis (most common)
- 1 Mbps: High-speed diagnostic
Network Colors
TrueFidelity uses color coding for quick network identification: - Red: CAN bus - Light Blue: LIN bus - Dark Blue: Ethernet - Green: FlexRay
Step 6: Save the System
It's important to save your work regularly. TrueFidelity stores your complete system configuration including all ECUs, networks, and connections.
- Save your system using one of these methods:
- Press Ctrl+S (Windows/Linux) or Cmd+S (macOS)
- Click File → Save from the menu bar
- Click the Save icon in the toolbar
- Verify the save location:
- The save dialog shows your project folder
- File name:
truefidelity-system.json(default name) -
This is a JSON file containing your complete system definition
-
Confirm the save was successful:
- Look for "System saved" notification in the bottom-right
- The window title updates to show the saved file name
- The save icon in the toolbar becomes grayed out
Auto-save Feature
TrueFidelity automatically saves your work every 5 minutes by default. You can adjust this in Settings → Preferences → Auto-save interval.
File Format
The truefidelity-system.json file contains:
- ECU configurations and properties
- Network topology and connections
- Firmware paths and build settings
- Diagram layouts and visual positions
- Project metadata and version information
Step 7: Build Firmware (Optional)
If you have firmware source code and want to build it within TrueFidelity, this section guides you through the integrated build process. Skip this if you're using pre-built binaries.
Understanding the Build System
TrueFidelity includes an integrated firmware build system that:
- Uses Docker containers with pre-configured toolchains (Zephyr SDK, ARM GCC, etc.)
- Supports Zephyr RTOS projects with west build integration
- Provides real-time progress feedback during compilation
- Automatically detects board configurations from your source code
Switching to Source Code Mode
-
Select an ECU that you want to build firmware for (e.g., VCU)
-
Change to Source Code mode in the Properties panel:
- Scroll to the SOFTWARE section
- Find the Firmware Mode option
- Select Source Code radio button
- New configuration fields appear below
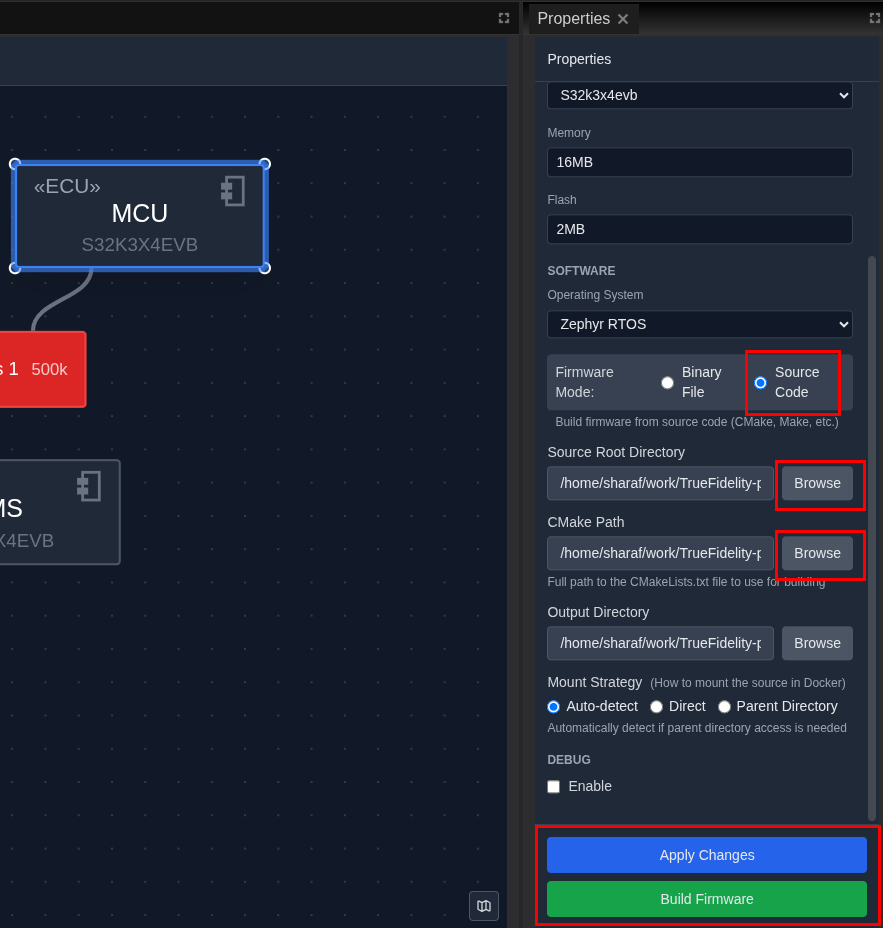
- Configure the source code paths:
Source Root:
- Click Browse next to the Source Root field
- Navigate to your firmware application directory (e.g., s32k3-vcu-demo/app)
- This should be the directory containing your Zephyr application
- The path appears in the field after selection
CMakeLists.txt Path:
- Click Browse next to the CMakeLists Path field
- Select the CMakeLists.txt file in your application directory
- This file defines your Zephyr build configuration
- Verify source configuration:
- Both paths should point to valid locations
- The Source Root should contain a
boards/directory with your board definition - The CMakeLists.txt should reference the correct board (e.g.,
s32k3x4evb)
Starting the Build
- Initiate the build process:
- Click the green Build Firmware button in the Properties panel
- A build dialog appears showing your configuration
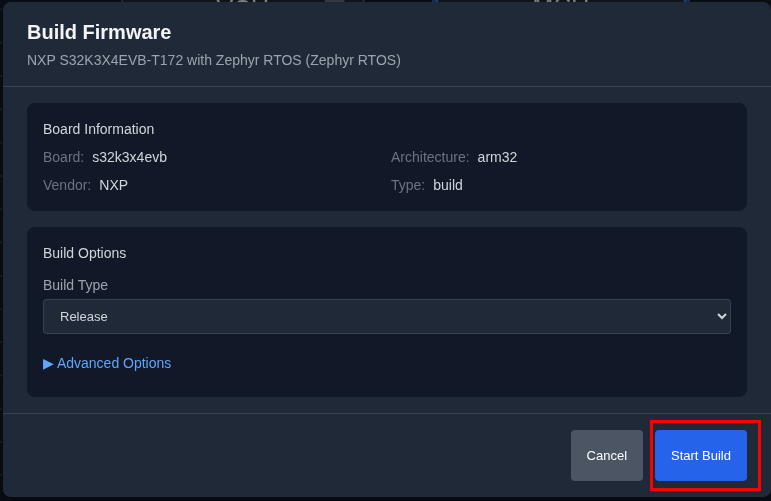
- Start the build:
- Review the build configuration in the dialog
- Click the Start button to begin compilation
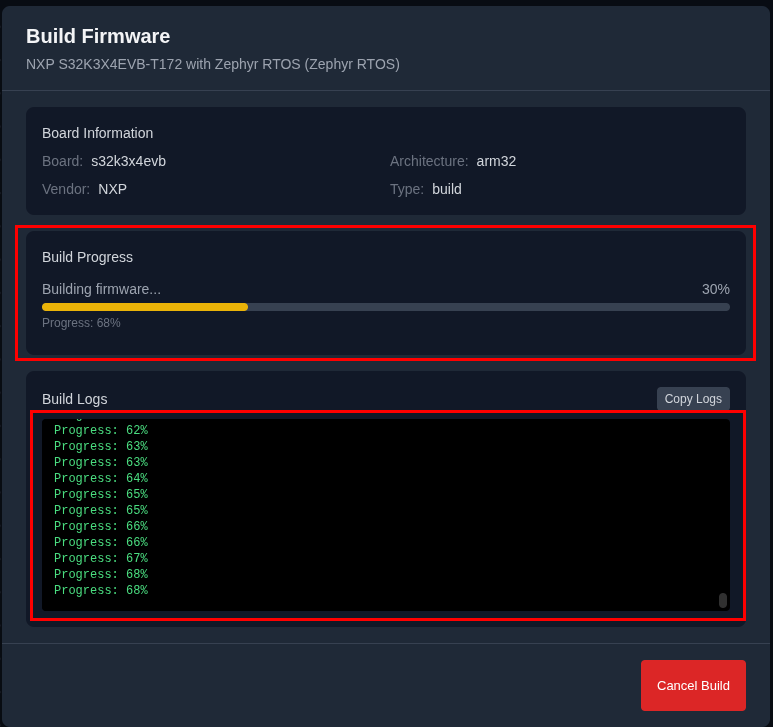
-
The dialog transitions to show build progress
-
Monitor build progress:
- The dialog shows real-time progress percentage (0% → 100%)
- Build stages include:
- Loading Zephyr modules
- Configuring CMake
- Compiling source files
- Linking executable
- Typical build time: 1-3 minutes for a simple application
- Observe the build output:
- Component messages appear as drivers are included:
Load components for S32K344: driver_common component is included. driver_flexcan component is included. driver_lpspi component is included. driver_lpuart component is included. - Compilation progress shows files being built:
[120/170] Building C object zephyr/drivers/spi/...
     [150/170] Linking C static library...
     [169/170] Linking C executable zephyr/zephyr.elf
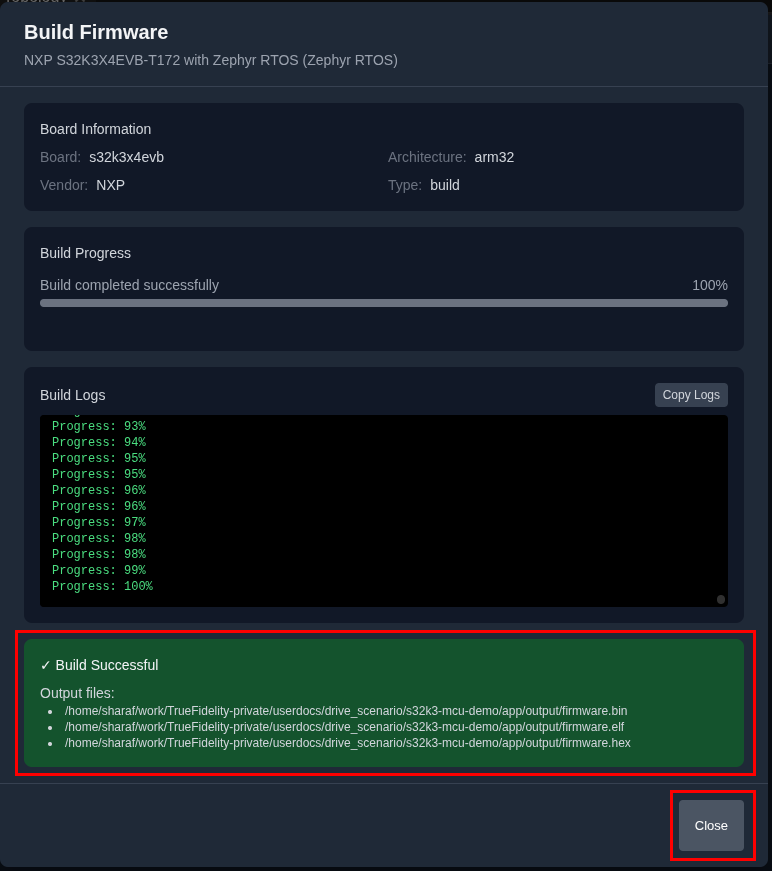
Build Output
- Review build results:
On Success:
- A success message displays confirming the build completed
- The firmware binary path automatically updates in ECU properties
- The binary is ready for deployment (typically zephyr.elf)
- Click Close to dismiss the dialog
On Failure: - Error messages display in the build output - Common issues include: - Missing board definition files - Incorrect CMakeLists.txt configuration - Missing device tree nodes - Check the error message for specific file and line information
- Click Apply Changes to save the firmware configuration
Firmware Source Requirements
For successful builds, your firmware source should include:
app/
├── CMakeLists.txt          # Zephyr build configuration
├── prj.conf                # Kconfig settings
├── src/
│   └── main.c              # Application source code
└── boards/
    └── arm/
        └── s32k3x4evb/     # Custom board definition
            ├── s32k3x4evb.dts
            ├── s32k3x4evb_defconfig
            ├── s32k3x4evb-pinctrl.dtsi
            └── Kconfig.board
TrueFidelity Build System
The integrated build system uses:
- Docker containers: Pre-configured Zephyr SDK and toolchains
- West build: Standard Zephyr build tool integration
- Board auto-detection: Reads board name from CMakeLists.txt
- Incremental builds: Faster rebuilds after initial compilation
Build Best Practices
- Ensure your board definition matches the ECU's Board setting in Properties
- Keep the Source Root path as short as possible to avoid path length issues
- If builds fail, check that all required device tree nodes are defined
- Use the Memory region output to verify your application fits in available flash/RAM
Common Build Errors
- "No board named 'xyz' found": Add board definition to
boards/arm/<board>/directory - "BOARD_ROOT element without 'boards' subdirectory": Set
BOARD_ROOTin CMakeLists.txt to the directory containingboards/ - Device tree errors: Ensure all referenced nodes (like
&lpspi1) are enabled in the DTS file
Step 8: Deploy and Start ECUs
Now we'll deploy your ECUs as Docker containers and start them running. This is where your static design becomes a live, executing system.
Starting the System
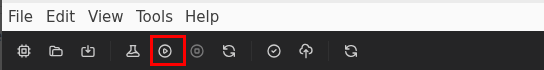
- Start the entire system from the toolbar:
- Locate the Start button in the main toolbar (green play icon)
- Click it to begin system deployment
- A progress dialog appears showing "Starting ECUs..."
Toolbar Start vs Individual Start
The toolbar Start button deploys all ECUs simultaneously. There's no right-click context menu on individual ECUs - use the toolbar for system-wide control.
- Monitor the startup process:
- ECUs transition through states: Stopped → Starting → Running
- The STATUS column shows a green dot when running
- CPU and Memory values begin updating with real-time data
-
UPTIME starts counting from 00:00:00
-
Wait for all ECUs to reach Running state:
- All three ECUs (VCU, MCU, BMS) start in parallel
- Full system startup usually takes 10-30 seconds
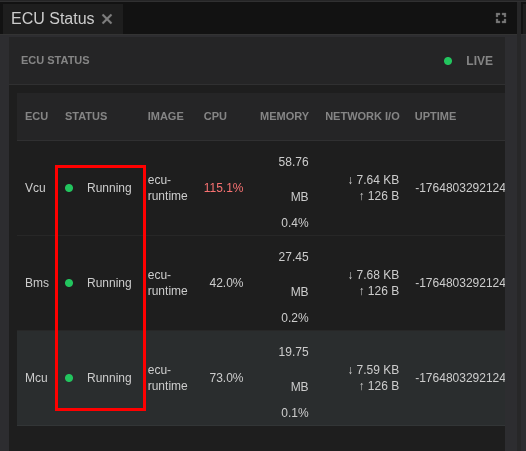
Understanding the ECU Status Panel
The ECU Status panel shows the state of all ECUs in your system:
- ECU: Name of each ECU
- STATUS: Current state (Stopped/Running)
- IMAGE: Docker image being used
- CPU: Processor usage percentage
- MEMORY: RAM usage
- NETWORK I/O: Data transfer rates
- UPTIME: How long the ECU has been running
If the ECU Status panel is not visible, open it via View → Panels → ECU Status.
Understanding Status Indicators
The ECU Status panel uses visual indicators:
- Green dot + "Running": ECU is active and healthy
- Gray dot + "Stopped": ECU is not deployed
- Yellow dot + "Starting": ECU is being deployed
- Red dot + "Error": ECU failed to start (check Console for details)
Resource Monitoring
Once running, observe the resource usage:
- CPU %: Shows processor load (normal: 0.1-5% idle, 20-80% under load)
- Memory: Displays RAM usage in MB (should match configured limits)
- Network I/O: Updates when ECUs communicate over CAN bus
Performance Indicators
- Low CPU usage (< 1%) indicates idle ECUs
- Sudden CPU spikes might indicate processing events
- Memory should remain stable unless there's a leak
- Network I/O increases during message broadcasts
Docker Requirement
If ECUs fail to start, ensure: - Docker Desktop is running - Docker service has sufficient resources allocated - No firewall blocking Docker operations
Step 9: Monitor Running System
With your ECUs running, TrueFidelity provides comprehensive monitoring tools to observe system behavior, debug issues, and validate functionality. Let's explore each monitoring capability.
View ECU Hardware Status
The ECU Status panel provides your primary health dashboard:
- Verify system health:
- All three ECUs should show green "Running" status
- CPU usage typically stays below 5% when idle
-
Memory usage should be stable and within configured limits
-
Identify resource patterns:
- VCU may show slightly higher CPU when processing pedal sensor inputs
- MCU and BMS should have similar resource profiles
- Network I/O spikes indicate active CAN communication
View Console Logs
The ECU Console aggregates logs from all running ECUs in real-time:
- Open the ECU Console panel:
- Click the Console tab in the bottom panel area
- Logs begin streaming immediately from all ECUs
- Each line shows: Timestamp, Level, Source ECU, and Message
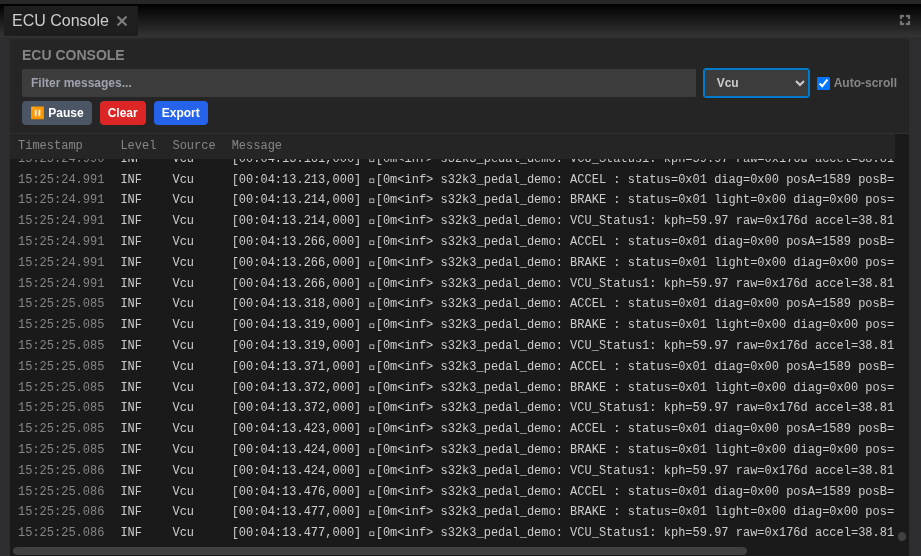
- Understanding log structure:
15:25:24.991 INF Vcu [00:04:13.213,000] e[0m<inf> s32k3_pedal_demo: ACCEL : status=0x01... - 15:25:24.991: Wall clock time
- INF: Log level (INFO)
- Vcu: Source ECU name
- [00:04:13.213,000]: ECU runtime timestamp
-
Message content: Actual log data
-
Filter logs effectively:
- Filter by ECU: Select specific ECU from dropdown (e.g., "Vcu")
- Filter by level: Toggle INFO, WARNING, ERROR, DEBUG buttons
- Text search: Type keywords in the filter box
-
Auto-scroll: Keeps latest logs visible (toggle off to inspect specific entries)
-
Console controls:
- Pause: Freezes log display for detailed inspection
- Clear: Removes all logs from display (doesn't affect ECU operation)
- Export: Saves current logs to file for analysis
Debugging with Logs
- Watch for ERROR level messages (red) indicating problems
- INFO messages (white) show normal operation flow
- DEBUG messages (gray) provide detailed internal state
- Correlation IDs in messages help trace request flows
Monitor Resources
- Open the Resource Monitor panel:
- Shows real-time CPU and memory graphs
- Each ECU has its own colored line
- X-axis shows time, Y-axis shows percentage/MB
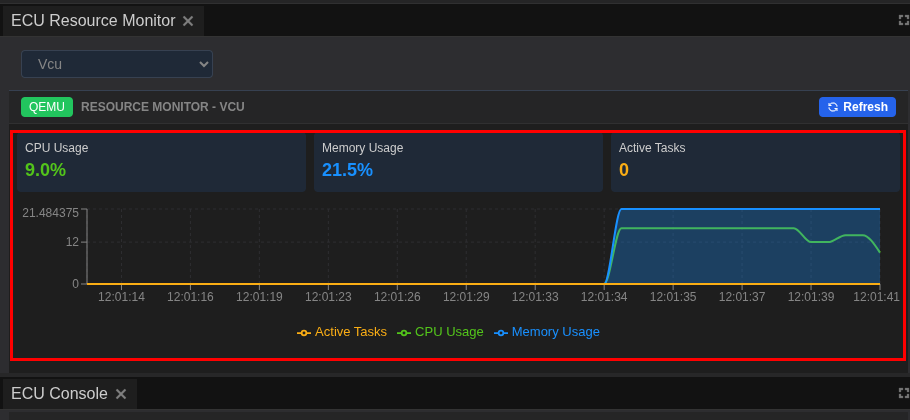
- Interpret the graphs:
- Steady lines: System running normally
- Spikes: Processing events or message handling
- Gradual increase: Possible memory leak
-
Sudden drops: ECU restart or resource release
-
Adjust monitoring window:
- Use dropdown to select: 1 min, 5 min, 15 min, 30 min
- Shorter windows show more detail
- Longer windows reveal trends
View Network Traffic
The Network Traffic panel displays CAN bus communication:
- Monitor CAN messages:
- Real-time display of all CAN frames
- Shows ID, DLC, Data, Timestamp, and Count
- Updates as ECUs exchange messages
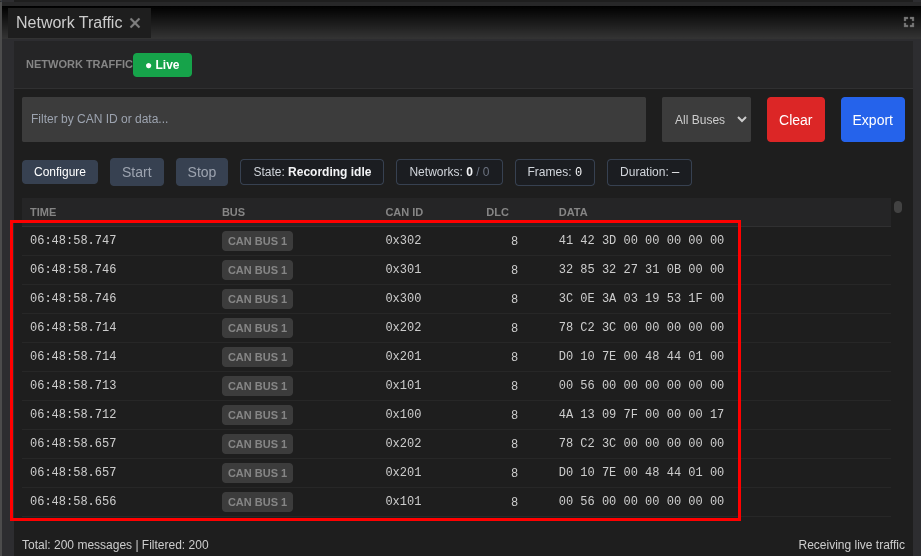
- Filter traffic:
- By CAN ID (e.g.,
0x123) - By source ECU
-
By data patterns
-
Analyze communication patterns:
- Periodic messages (heartbeats, status)
- Event-driven messages (state changes)
- Request-response pairs
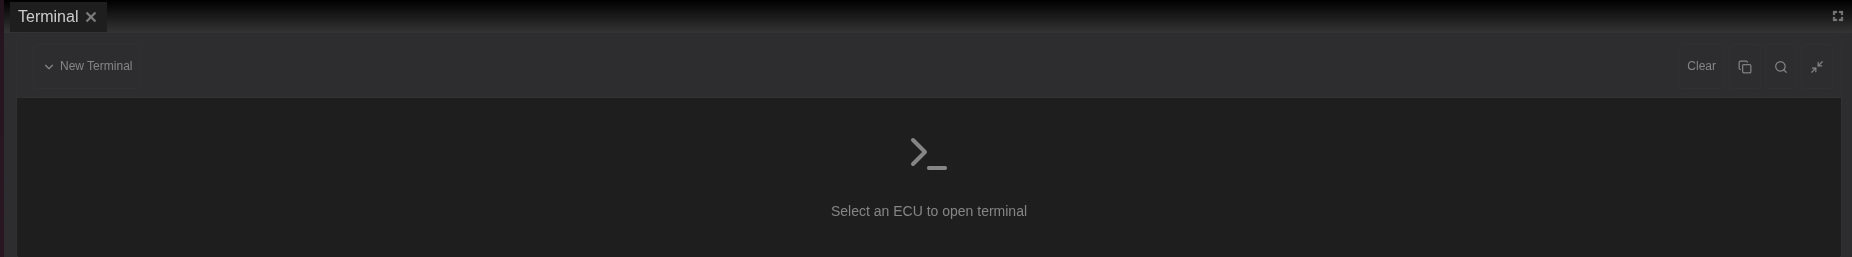
Access ECU Terminals
The Terminal panel provides shell access to ECU containers:
- Open the Terminal panel:
- Located in the bottom panel area
-
Shows a dropdown selector for ECU choice
-
Select an ECU for terminal access:
- Use the dropdown to choose an ECU (e.g., "VCU")
- Terminal connects automatically if the OS supports it
- Shell prompt appears when connected
- Execute diagnostic commands: ```bash # Check running processes ps aux
# View memory usage cat /proc/meminfo
# Check network interfaces ip addr show
# View CAN interface status ip link show can0 ```
Terminal Availability
Terminal access requires: - ECU running Linux-based OS (FSL Linux, Ubuntu, etc.) - Debug mode enabled in ECU configuration - Proper shell binary in the container image - Note: The VCU, MCU, and BMS in this tutorial use Zephyr OS, which has limited terminal support. For full terminal access, use Linux-based ECUs.
Monitoring Best Practices
- Keep Console open during testing to catch errors immediately
- Use Resource Monitor to identify performance bottlenecks
- Export logs before stopping ECUs to preserve diagnostic data
- Terminal access is powerful but should be used carefully in production
Stopping the System
When you're done monitoring or need to make changes:
- Stop all ECUs using the toolbar:
- Click the Stop button (red square icon) in the main toolbar
- All ECUs begin shutting down simultaneously
- STATUS changes from "Running" to "Stopping" to "Stopped"

- Verify clean shutdown:
- Check Console for any error messages during shutdown
- ECU Status panel shows all ECUs with gray "Stopped" status
Step 10: Debugging ECUs (Optional)
TrueFidelity supports remote debugging of ECU firmware using GDB. This allows you to set breakpoints, inspect variables, and step through code while the ECU runs in the simulated environment.
Enable Debug Mode
Before starting the system, you must enable debugging for the ECU you want to debug:
-
Select the ECU on the System Canvas (e.g., VCU)
-
Enable debug options in the Properties panel:
- Scroll to the DEBUG section
- Check Enable Debug Mode to activate the GDB server
- Optionally check Wait for Debugger if you want the ECU to pause at startup until a debugger connects
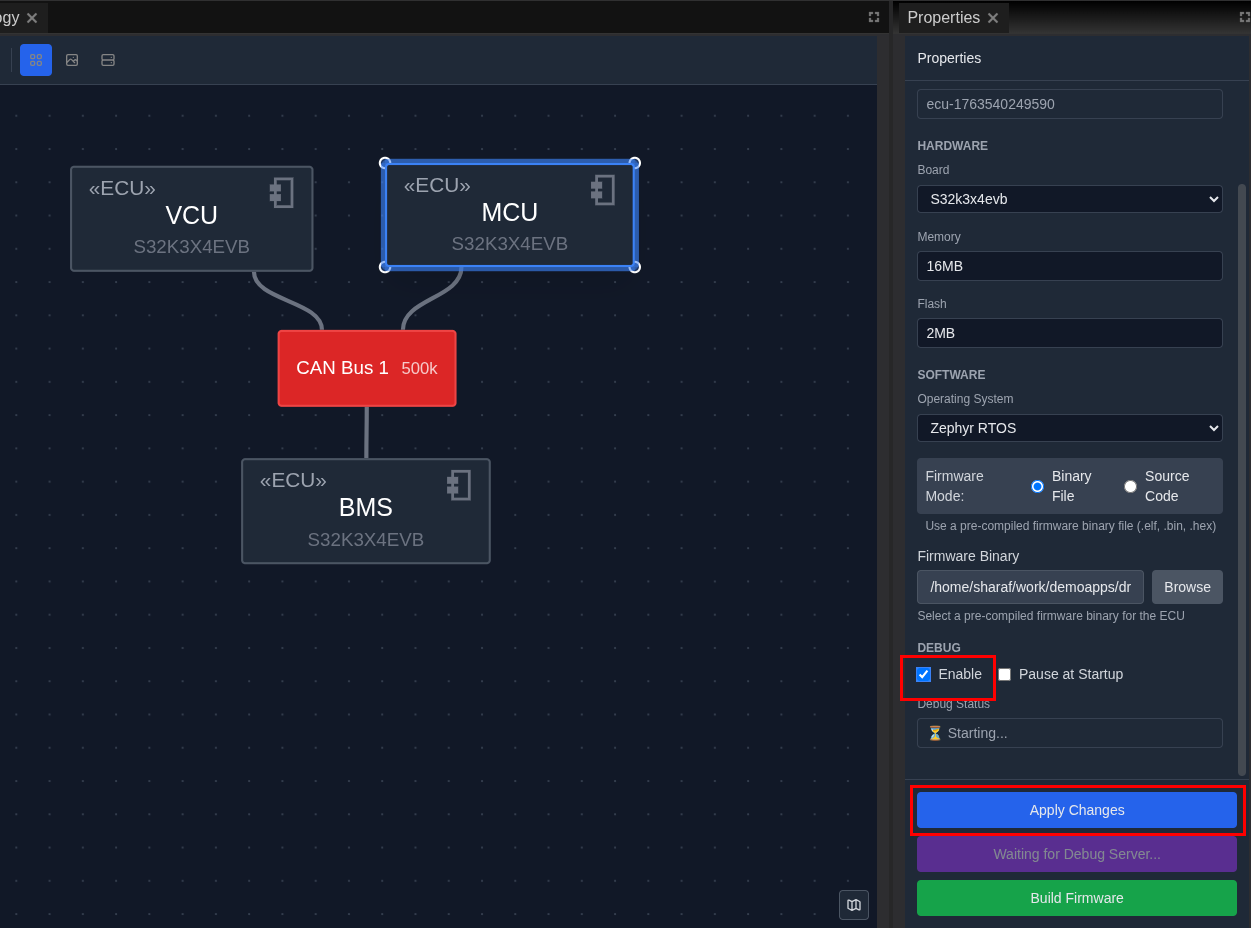
- Click Apply Changes to save the debug settings
Enable Before Starting
Debug mode must be enabled before starting the system. If the system is already running, stop it first, enable debug mode, then restart.
Get Debug Configuration
Once debug mode is enabled, TrueFidelity provides ready-to-use debug configurations:
-
Select the ECU with debug mode enabled
-
Locate the debug configuration options in the Properties panel DEBUG section:
- GDB Client Command: The command line to connect a GDB client
- VS Code Launch Config: A JSON configuration for VS Code debugging
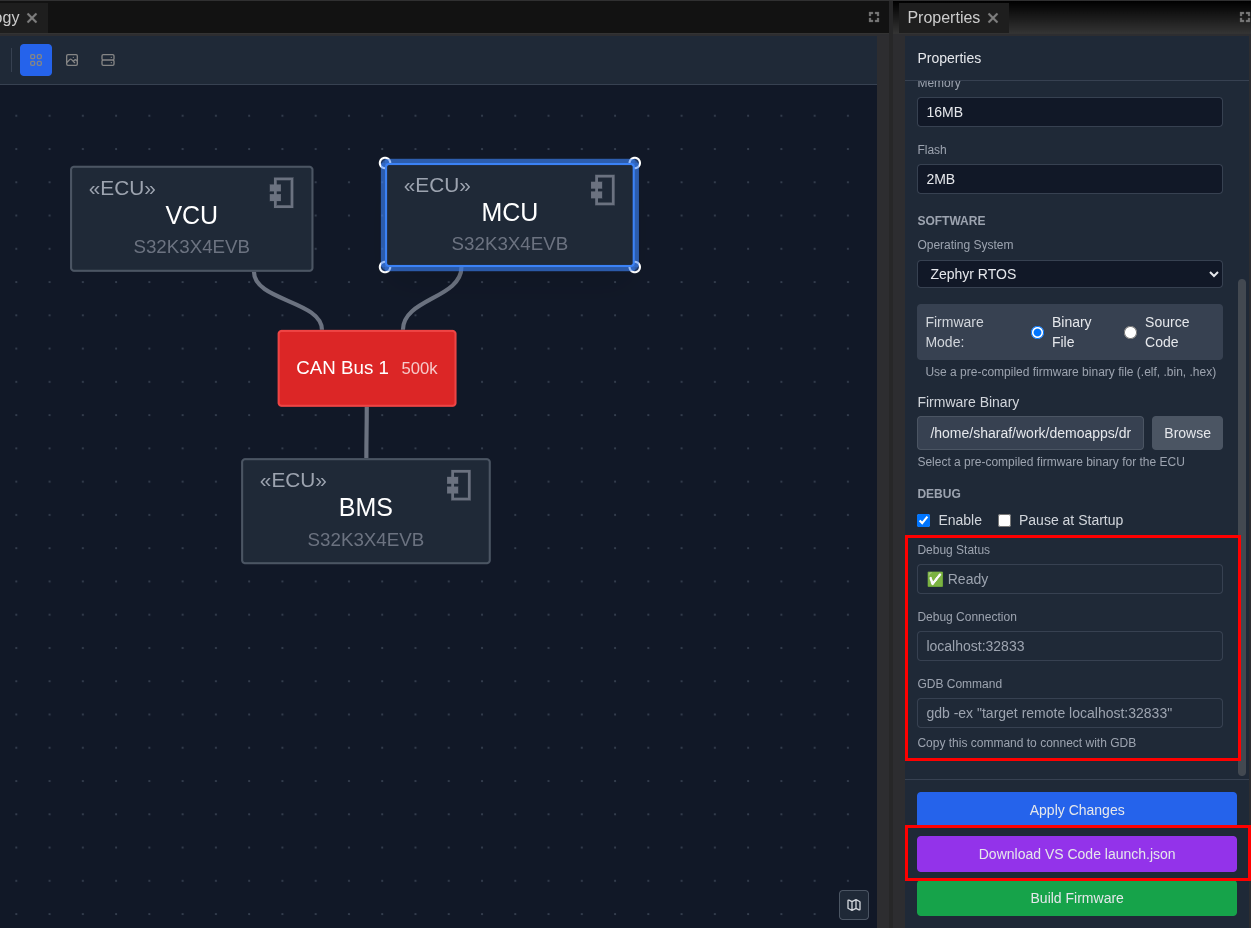
- Copy the configuration you need:
- Click the Copy button next to the GDB command or VS Code config
- The configuration is copied to your clipboard
Using VS Code for Debugging
To debug your ECU firmware in VS Code:
- Start the system with debug mode enabled
- The ECU will start with GDB server listening
-
If "Wait for Debugger" is enabled, the ECU pauses until you connect
-
Open your firmware project in VS Code
-
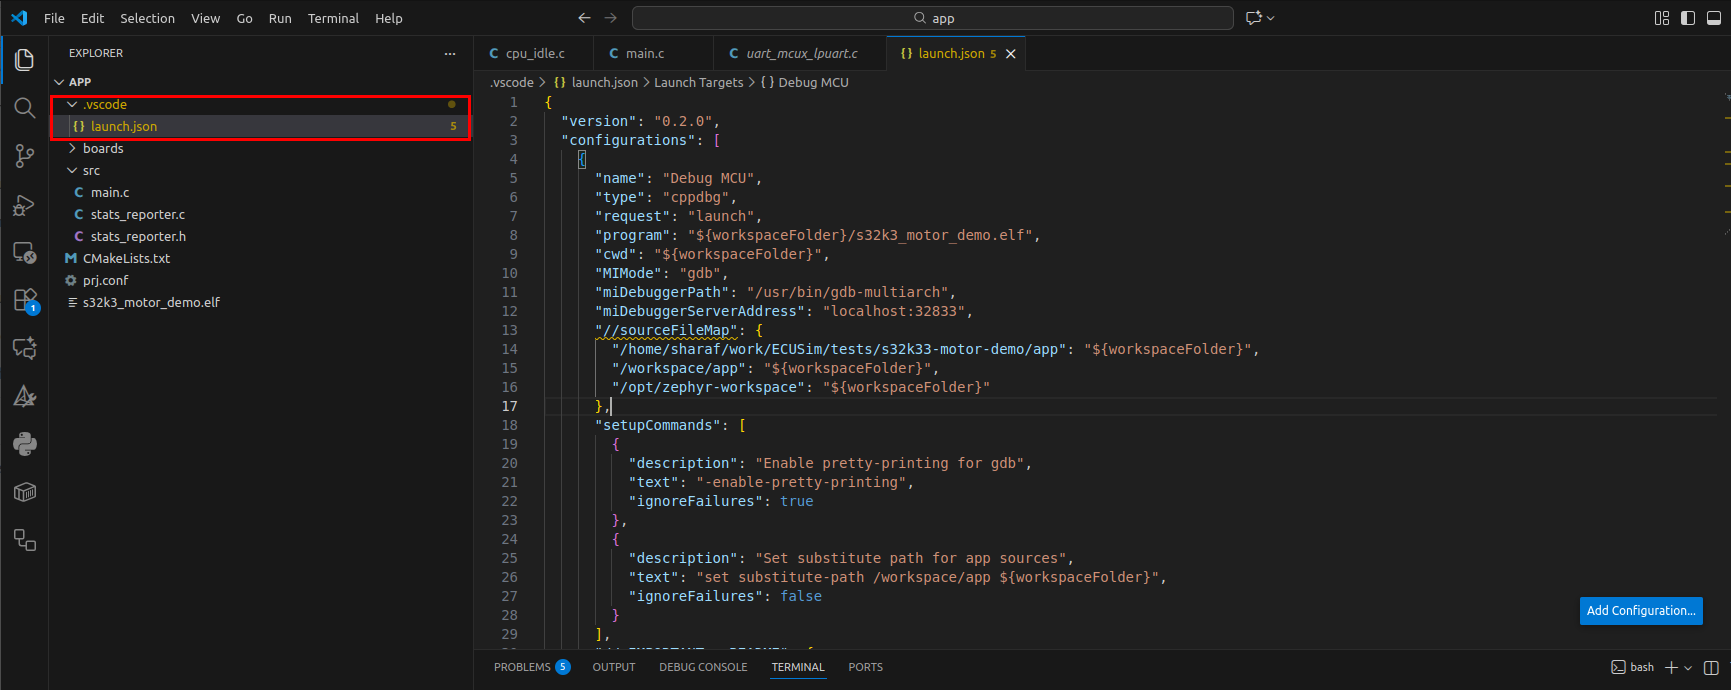
Create or update launch.json:
- Open the Run and Debug panel (Ctrl+Shift+D)
- Click "create a launch.json file" or open existing
.vscode/launch.json - Paste the copied VS Code Launch Config
Example configuration:
json
   {
       "version": "0.2.0",
       "configurations": [
           {
               "name": "Debug VCU",
               "type": "cppdbg",
               "request": "launch",
               "program": "${workspaceFolder}/build/firmware.elf",
               "MIMode": "gdb",
               "miDebuggerPath": "/usr/bin/gdb-multiarch",
               "miDebuggerServerAddress": "localhost:3333",
               "setupCommands": [
                   {
                       "description": "Enable pretty-printing",
                       "text": "-enable-pretty-printing",
                       "ignoreFailures": true
                   }
               ]
           }
       ]
   }
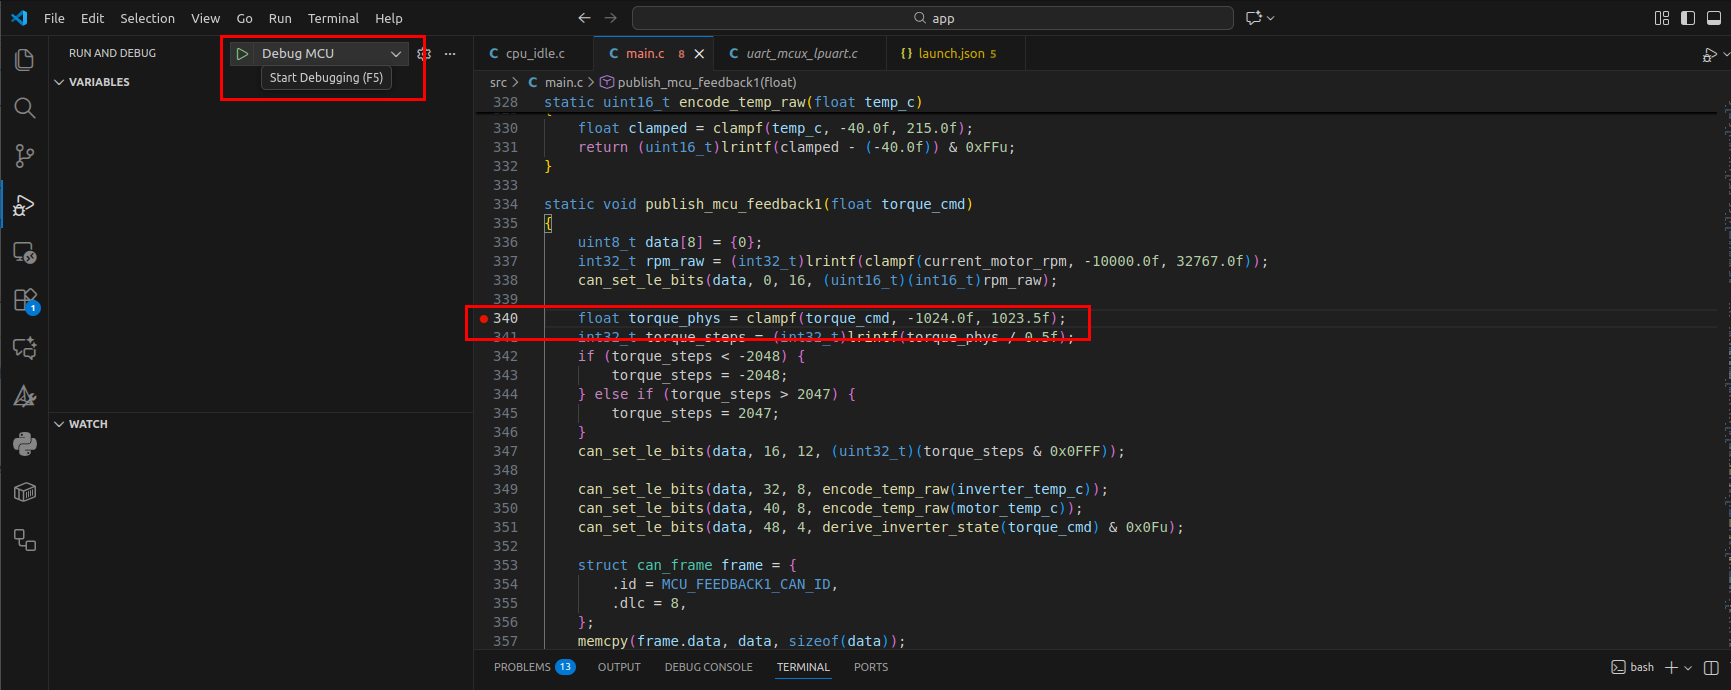
- Set breakpoints in your source code:
- Open your firmware source file
-
Click in the gutter (left margin) to set a breakpoint (red dot appears)
-
Start debugging:
- Select the debug configuration from the dropdown
- Press F5 or click the green play button
- VS Code connects to the GDB server running in TrueFidelity
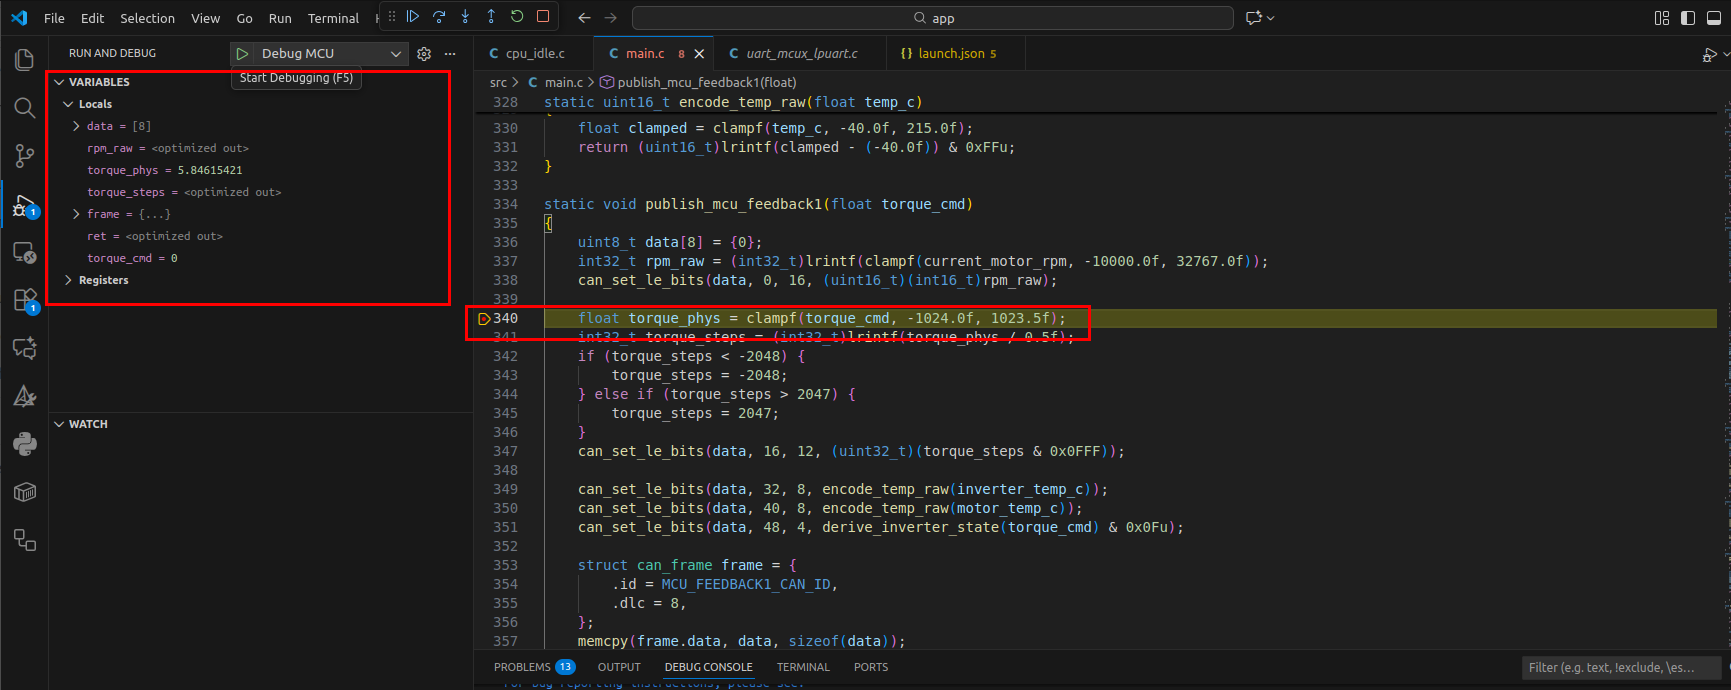
- Debug your firmware:
- Execution pauses at your breakpoint
- Use the debug toolbar to step through code (Step Over, Step Into, Continue)
- Inspect variables in the Variables panel
- View the call stack in the Call Stack panel
Using GDB Command Line
For command-line debugging:
-
Start the system with debug mode enabled
-
Open a terminal and run the GDB client command:
bash gdb-multiarch -ex "target remote localhost:3333" build/firmware.elf -
Use standard GDB commands:
(gdb) break main          # Set breakpoint at main
   (gdb) continue            # Continue execution
   (gdb) next                # Step over
   (gdb) step                # Step into
   (gdb) print variable      # Print variable value
   (gdb) backtrace           # Show call stack
Debug Multiple ECUs
Each ECU with debug enabled gets its own GDB port. Check the Properties panel for the specific port assigned to each ECU.
Performance Impact
Debug mode adds overhead to ECU execution. Disable it for performance testing or when debugging is not needed.
Step 11: Cleanup and Best Practices
After completing your tutorial session, properly clean up resources and prepare for future work.
Clean Up Resources
- Export valuable data before closing:
- Export logs: Click Export in Console panel to save diagnostic data
-
Document findings: Note any issues or observations for future reference
-
Close the system project:
- Click File → Close
- Choose to save any unsaved changes
-
The workspace returns to empty state
-
Clean up Docker resources (optional): ```bash # List TrueFidelity containers docker ps -a | grep truefidelity
# Remove stopped containers docker container prune
# Clean up unused networks docker network prune ```
- Archive or delete tutorial files:
- Navigate to your project folder
- Archive
truefidelity-system.jsonfor reference - Or delete if this was just for learning
What You've Learned
Congratulations! You've successfully:
- ✅ Created a multi-ECU automotive system from scratch
- ✅ Configured ECU hardware and software properties
- ✅ Built network topology with CAN bus connections
- ✅ Deployed ECUs as Docker containers
- ✅ Monitored real-time system behavior
- ✅ Debugged using logs and console access
Next Steps
Immediate Next Steps
- Explore advanced monitoring:
- Read the ECU Monitoring Walkthrough tutorial for deep-dive debugging
- Learn about Signal Analysis for CAN message inspection
-
Master Performance Profiling techniques
-
Build real firmware:
- Follow the Build Configuration Guide to compile actual ECU code
- Set up the tf-build toolchain for cross-compilation
-
Integrate your existing firmware projects
-
Customize your workspace:
- Explore Workspaces & Layouts to create role-specific views
- Save custom layouts for different workflows
- Configure keyboard shortcuts for efficiency
Advanced Topics
- Multi-Network Systems: Create complex topologies with multiple CAN/LIN buses
- Gateway Routing: Configure message routing between networks
- HIL Integration: Connect to real hardware for Hardware-in-Loop testing
- Scripting and Automation: Use TrueFidelity's API for automated testing
- Cloud Deployment: Deploy systems to Kubernetes clusters
Learning Resources
- Documentation: Review Reference section for detailed feature guides
- Video Tutorials: Watch walkthroughs on the TrueFidelity YouTube channel
- Community Forum: Join discussions and get help from other users
- Support: Contact support@truefidelity.io for technical assistance
Troubleshooting Guide
Common Issues and Solutions
ECUs Won't Start
Symptoms: ECUs remain in "Stopped" state, won't transition to "Running"
Solutions: 1. Verify Docker Desktop: - Ensure Docker Desktop is running (check system tray) - Restart Docker Desktop if needed - Check Docker resources (Settings → Resources → ensure adequate CPU/memory)
- Check error messages:
- Open Console panel before starting ECUs
- Look for red ERROR messages during startup
-
Common errors: "Image not found", "Port already in use"
-
Validate configuration:
- Ensure firmware paths are correct (if specified)
- Verify memory limits are reasonable (minimum 128MB)
- Check network configuration is valid
Terminal Connection Fails
Symptoms: Terminal panel shows "Connection failed" or remains blank
Solutions: 1. Verify ECU compatibility: - Only Linux-based OS ECUs support terminal (FSL Linux, Ubuntu) - FreeRTOS and Zephyr ECUs don't have shell access
- Check ECU status:
- ECU must be in "Running" state
-
Wait 10-15 seconds after start for initialization
-
Enable debug mode:
- Select ECU in System Canvas
- In Properties, check "Enable" under DEBUG section
- Apply changes and restart ECU
Network Traffic Not Appearing
Symptoms: Network Traffic panel empty despite running ECUs
Solutions: 1. Verify network setup: - Ensure ECUs are connected to the same network bus - Check CAN bus configuration matches ECU expectations
- Check filters:
- Clear any filters in Network Traffic panel
-
Ensure correct bus is selected if multiple networks exist
-
Validate firmware:
- Firmware must actively send CAN messages
- Check Console for "CAN init" or network startup messages
High Resource Usage
Symptoms: Host system slows down, high CPU/memory usage
Solutions: 1. Limit concurrent ECUs: - Start with fewer ECUs initially - Add more gradually while monitoring resources
- Adjust resource limits:
- Reduce ECU memory allocations in Properties
-
Set CPU limits in Docker export configuration
-
Optimize Docker settings:
- Docker Desktop → Settings → Resources
- Reduce CPUs and memory allocated to Docker
- Enable resource limits per container
Pro Tip
Keep the Console panel visible during all operations - most issues reveal themselves through error messages before symptoms appear in the UI.
Getting Help
If you encounter issues not covered here: 1. Check the Reference → FAQ section 2. Search the community forum 3. Contact support with: - System logs (exported from Console) - System configuration (.tfsystem file) - Screenshots of the issue - Docker and OS version information