First Launch & Activation
Use this guide after installing TrueFidelity to complete activation, confirm Docker connectivity, and understand the default layouts you will see on day one.
Launching the App
- Start TrueFidelity from your platform application menu.
- A splash screen appears briefly, then the main window opens.
- If the splash screen hangs longer than 30 seconds, see Troubleshooting.
If the app cannot reach Docker, you will see a connection error screen. Start Docker and relaunch the app.
License & Activation
TrueFidelity requires a valid license to operate. On first launch (or whenever a valid license is missing), the License Configuration dialog appears automatically. The dialog supports three activation modes: License File, Self-Hosted Server, and TrueFidelity Cloud.
Step 1: Collect Hardware Information
Before requesting a license, you need to collect your machine's hardware information and send it to Nebula support.
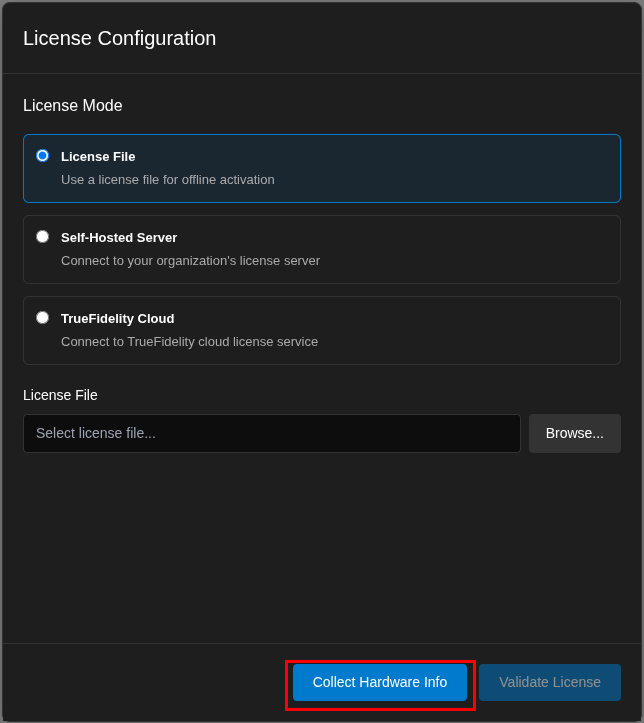
- In the License Configuration dialog, click Collect Hardware Info at the bottom
- The Hardware Information modal opens and automatically collects your system details
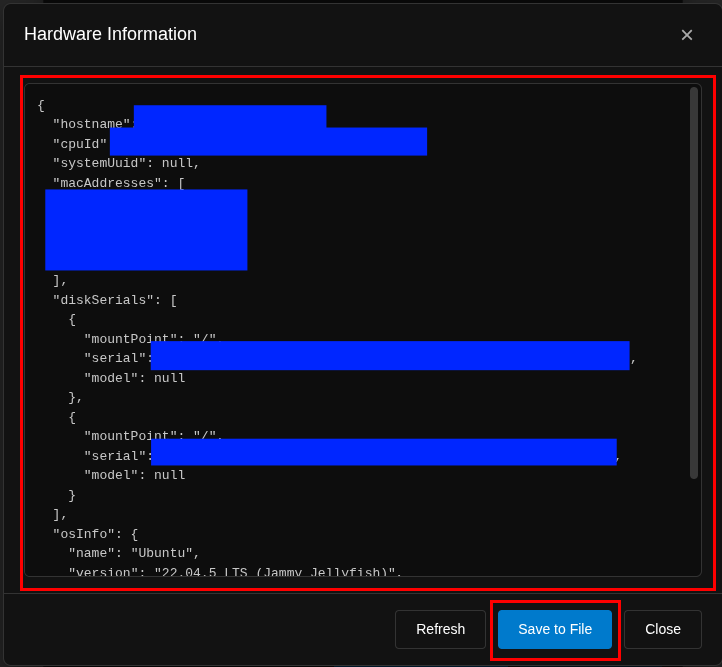
- Review the collected hardware information (includes hostname, CPU ID, MAC addresses, and disk serials)
- Click Save to File to save the hardware info as a JSON file
- Send the saved
hardware-info.jsonfile to support@nebula-automotive.com - Click Close to return to the License Configuration dialog
Hardware-Locked Licenses
Node-locked licenses are tied to your specific hardware. If you change major hardware components (CPU, network adapter, or disk), you may need to request a new license.
Step 2: Activate Your License
Once you receive your license file from Nebula support, you can activate it.
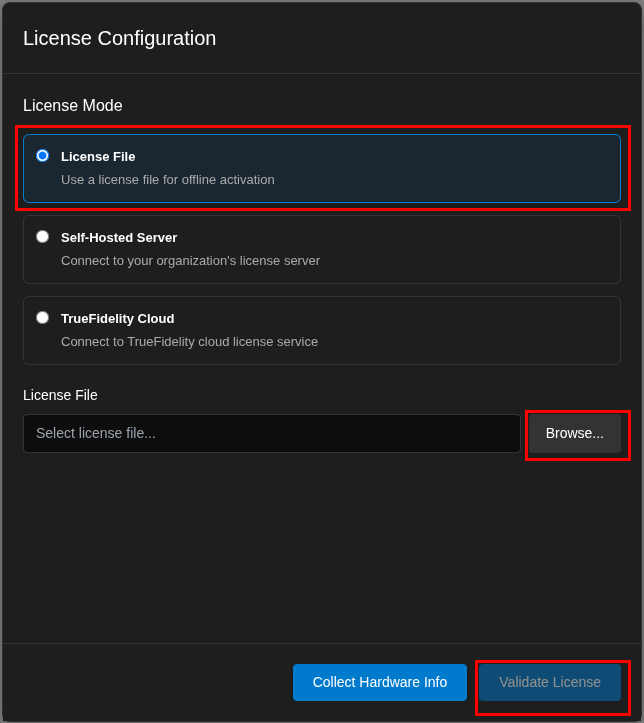
License File (Recommended for Offline Use)
- In the License Configuration dialog, select License File mode
- Click Browse... to open the file picker
- Navigate to and select your license file (
.jsonor.lic) - Click Validate License to activate
When validation succeeds: - The dialog shows your license details (type, edition, expiration date) - The status bar displays your license tier - The main application window becomes accessible
Self-Hosted Server (For Enterprise Deployments)
If your organization runs a license server:
- Select Self-Hosted Server mode
- Enter the Server URL provided by your IT administrator (e.g.,
https://licenses.yourcompany.com) - Enter your API Key if required
- Click Validate License
TrueFidelity Cloud
For cloud-based license management:
- Select TrueFidelity Cloud mode
- The server URL defaults to
https://licenses.truefidelity.io - Enter your API Key provided during purchase
- Click Validate License
License Status
After successful activation, the status bar at the bottom of the application shows:
- License tier: Community, Professional, or Enterprise
- License type: Node-locked or Floating
- Connection status: Valid, Grace Period, or Expired
Managing Your License
To view or change your license after activation:
- Go to File → Settings or click the settings icon
- Navigate to the License section
- View current license details or click Clear License to remove and re-activate
License Expiration
If your license expires or the license server becomes unreachable, TrueFidelity enters a grace period. You'll see a warning in the status bar. Contact support to renew your license before the grace period ends.
Verify Docker Connectivity
- Confirm the status bar shows Docker Connected.
- If Docker is disconnected, start Docker and relaunch the app.
- Container counts remain zero until you start a system.
Default Layout Walkthrough
The default workspace adapts based on your workflow mode.
System Design Mode (when creating new systems)
System design mode is the workspace for building ECU topologies, wiring networks, and configuring each element before you run the system.
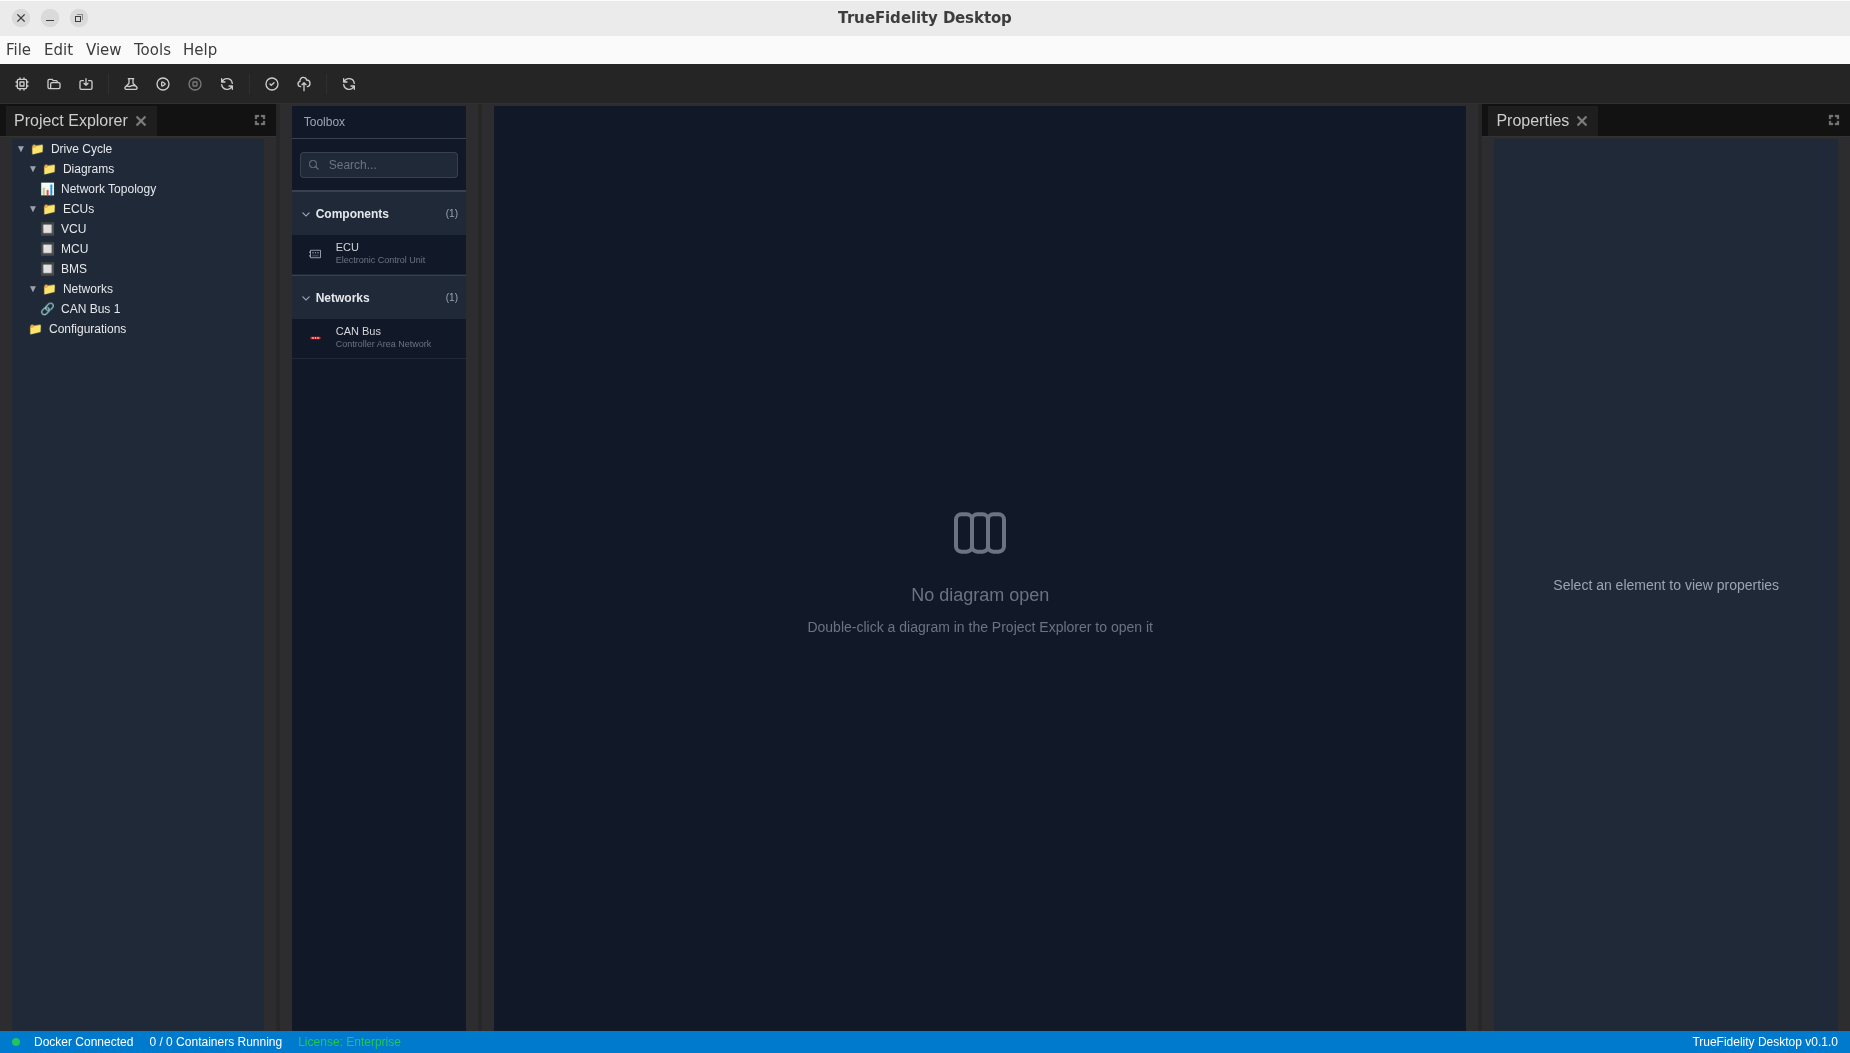
- Project Explorer (left) – System tree with Diagrams, ECUs, Networks, and Configurations. Double-click a diagram to open it.
- Toolbox (left, next to explorer) – Searchable component library for dragging ECUs and networks onto the canvas.
- System Canvas (center) – Shows an empty-state prompt until a diagram is opened; becomes the visual editor once active.
- Properties (right) – Empty until you select an element; then exposes configuration for the selected node or connection.
- Toolbar (top) – Quick actions for new/open/save, build, start/stop, validate, and refresh.
- Status bar (bottom) – Docker status, container count, license tier, and app version.
Monitoring Mode (when systems are running)
Monitoring mode surfaces runtime health, performance, and logs for your active ECU system at a glance.
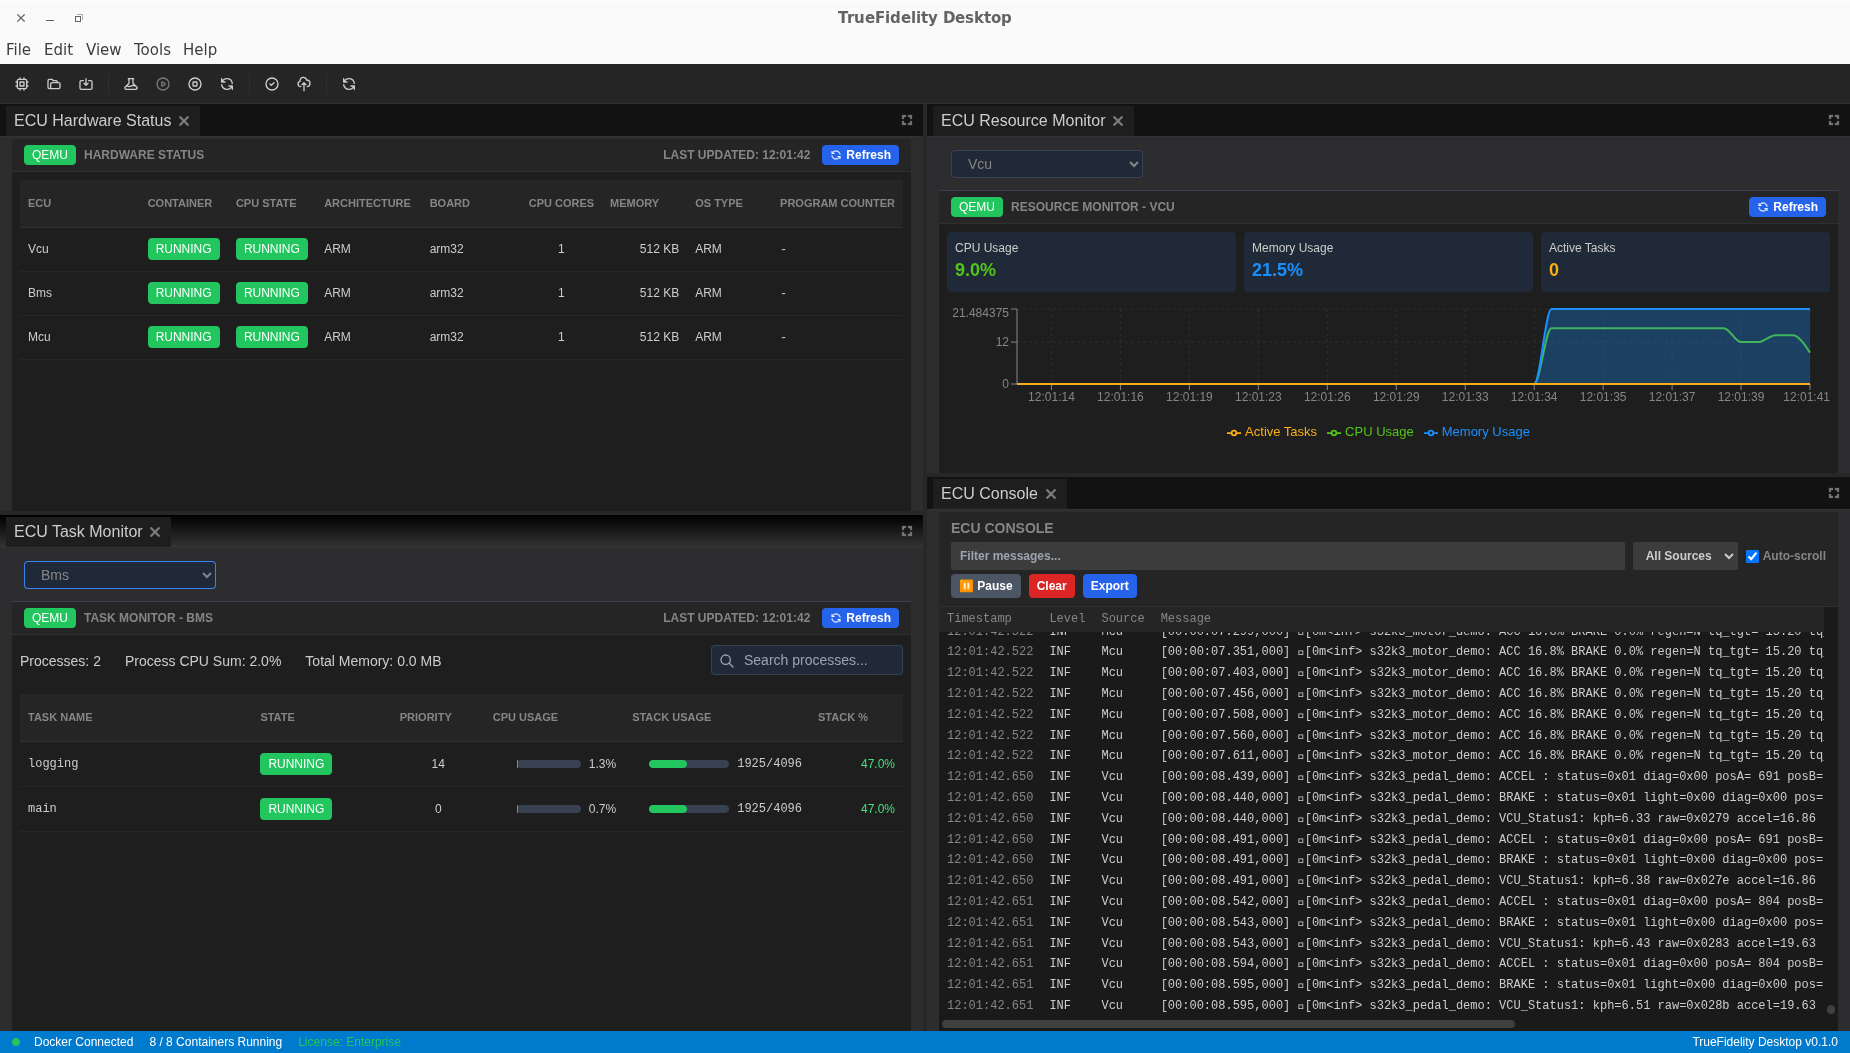
- ECU Hardware Status (top left) – Table of ECUs with container state, architecture, board, cores, memory, and OS type.
- ECU Resource Monitor (top right) – Per-ECU CPU and memory usage charts plus active task count.
- ECU Task Monitor (bottom left) – Process list for the selected ECU with CPU usage and stack metrics.
- ECU Console (bottom right) – Runtime log stream with filter, pause, clear, export, and auto-scroll.
CAN Log Analysis Mode (when analyzing log files)
CAN log analysis mode helps you inspect live or recorded CAN traffic, select signals from DBCs, and plot them over time.
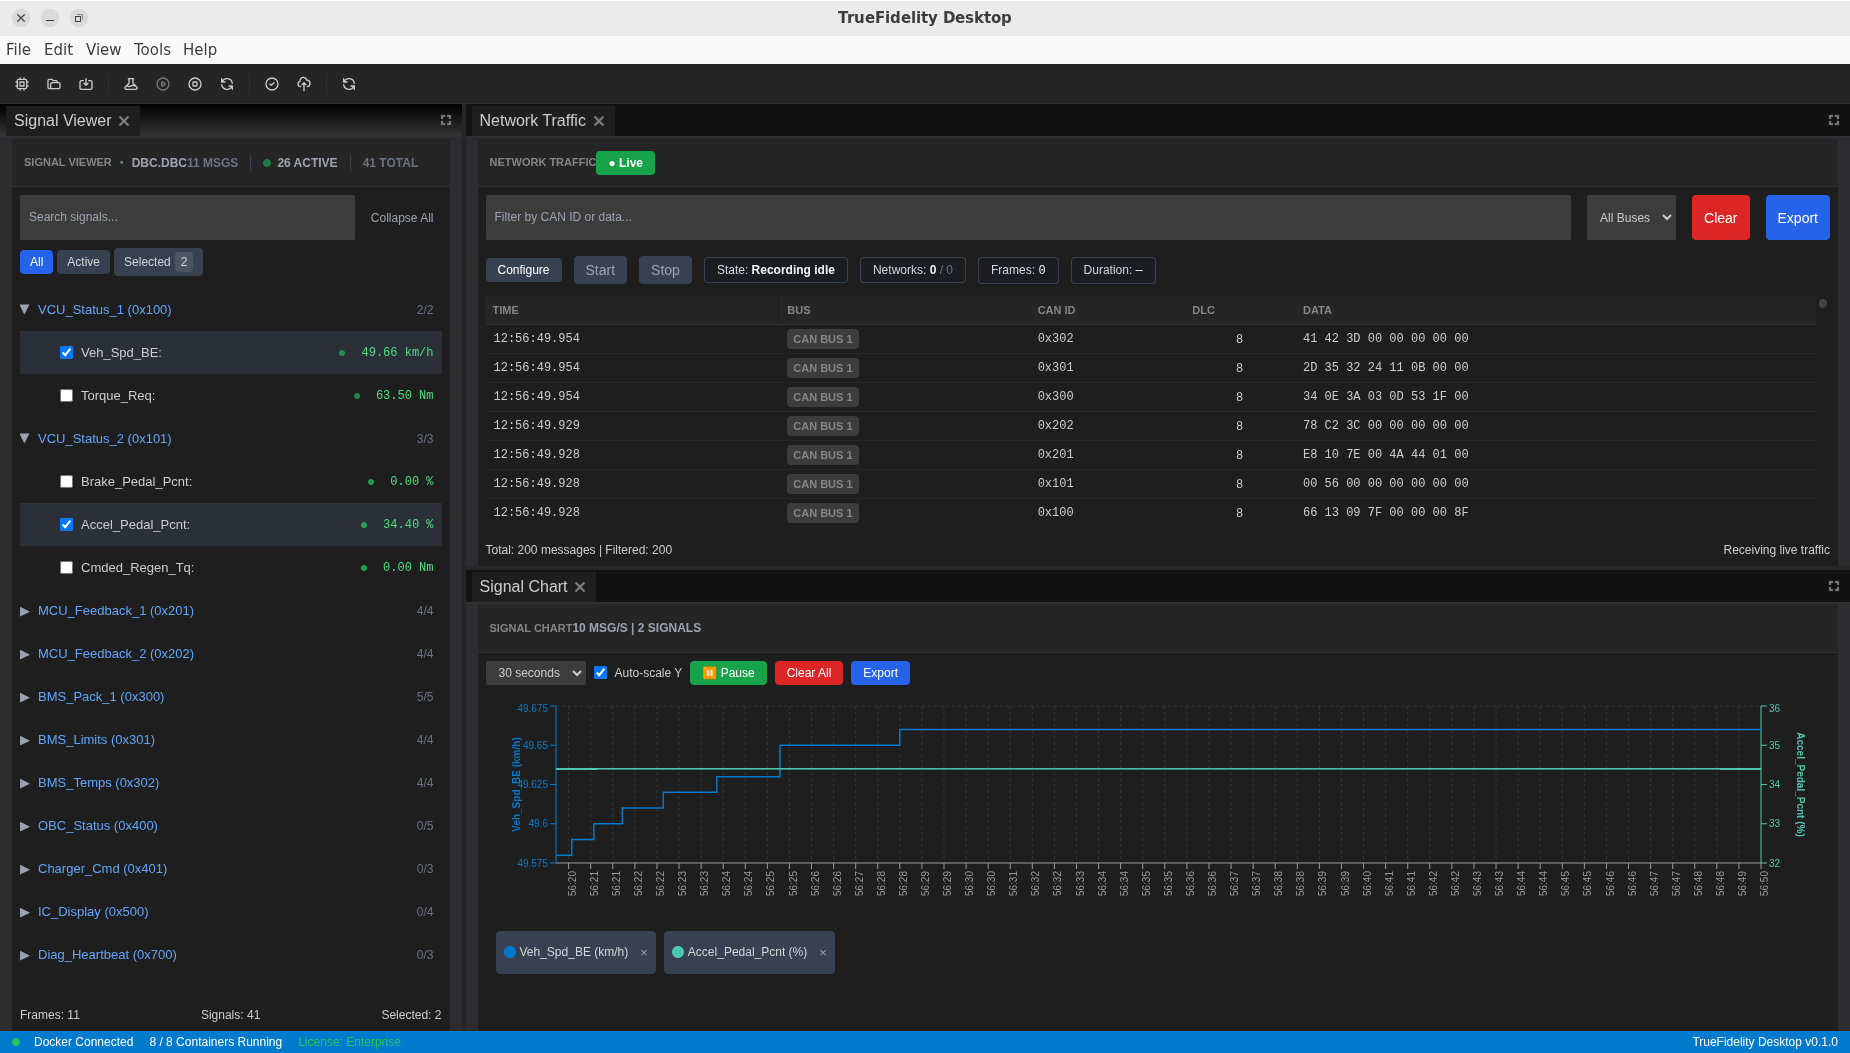
- Signal Viewer (left) – DBC-backed tree of frames and signals with filters and selection.
- Network Traffic (top right) – Live frame table with bus filters, recording controls, and export actions.
- Signal Chart (bottom right) – Time-series plots of selected signals with pause, auto-scale, and export.
First Run Test Workflows
Option A: System Design Smoke Test
- Create a new system with File → New.
- Double-click the default diagram to open it on the canvas.
- Drag an ECU and a CAN network from the Toolbox onto the canvas.
- Select the CAN network and set a DBC file in Properties.
- Save the system (Ctrl/Cmd + S) and confirm the file path.
Option B: Playback Smoke Test
- Open an existing system with a CAN network and DBC configured.
- Switch to the Signal Player & Injection panel (use the Network Analysis layout if needed).
- Click Select BLF... and choose a dataset.
- Click Inspect bundle, then Auto-select channels for the network.
- Start the system from the toolbar, then press Play in Signal Player.
- Verify frames appear in Network Traffic and signals plot in Signal Chart.
Note
Playback controls stay disabled until a system is running.
Troubleshooting First Launch
| Issue | Suggested Action |
|---|---|
| App window stays blank | Launch from a terminal with truefidelity --disable-gpu (Linux/macOS) or "TrueFidelity.exe" --disable-gpu (Windows). Update GPU drivers afterwards. |
| License dialog keeps appearing | Validate the license and confirm the status bar shows a license tier. |
| Docker disconnected | Start Docker and relaunch the app. |
| Missing panels | Select View → Reset Windows to restore the default arrangement. |
Collecting Support Information
If you encounter an issue during first launch:
- Use Help → Show Logs to open the log directory.
- Compress the most recent log files.
- Capture screenshots of any error dialogs.
- Include the app version from Help → About.
- Submit the bundle to your support channel.
What’s Next
- Move on to the Quick Start guide for a five-minute workflow that covers playback and exporting.
- Read Workspaces & Layouts to learn how to customize the interface.
- Review DBC & Signal Definitions to prepare shared DBC files.