Playback Analysis Walkthrough
This tutorial focuses on analyzing CAN bus data through log playback, signal decoding, and pattern identification. You'll learn how to load captured logs, decode signals using DBC files, identify anomalies through visualization, and export findings for further analysis. This walkthrough represents a typical debugging workflow that automotive engineers use to diagnose EV powertrain issues.
Time Estimate
- System Setup: 10-15 minutes
- Playback Configuration: 10-15 minutes
- Signal Analysis: 15-20 minutes
- Data Export: 5-10 minutes
- Total Time: 40-60 minutes
Prerequisites
Before starting this tutorial, ensure you have:
- TrueFidelity Desktop application running
- A configured system with CAN network (or complete the System Design Workflow tutorial first)
- Sample BLF log files for playback
- The Drive Cycle DBC file with signal definitions
- Basic understanding of CAN signals and EV powertrain systems
Learning Objectives
By completing this tutorial, you will:
- Master the Signal Player panel for BLF playback
- Understand signal decoding with DBC files
- Learn to identify patterns in time-series data
- Use filtering to focus on relevant signals
- Export data for external analysis
- Troubleshoot common playback issues
Scenario Overview
You're investigating regenerative braking behavior in an electric vehicle's drive cycle system. The test engineers report:
- Inconsistent energy recovery during deceleration
- Occasional torque command/feedback mismatches
- Battery current fluctuations during regen events
Your task is to:
- Load and analyze the captured CAN log
- Identify motor and battery signals during regen
- Find anomalies in torque delivery
- Quantify energy recovery patterns
- Document findings for the team
The log contains 15 minutes of data from an EV test drive, including VCU commands, MCU feedback, and BMS status messages.
Part 1: System Preparation
Step 1: Load or Verify Your System
Before analyzing logs, you need a configured system with a CAN network and DBC file.
- Launch TrueFidelity Desktop:
- The application opens in System Design mode
-
Check if you have an existing Drive Cycle system
-
Open an existing system (recommended):
- Click File → Open
- Navigate to your
truefidelity-system.jsonfile - Click Open
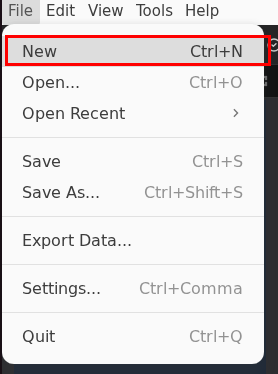
Or create a new system if needed:
- Click File → New
- Name it RegenAnalysis
- Click Create
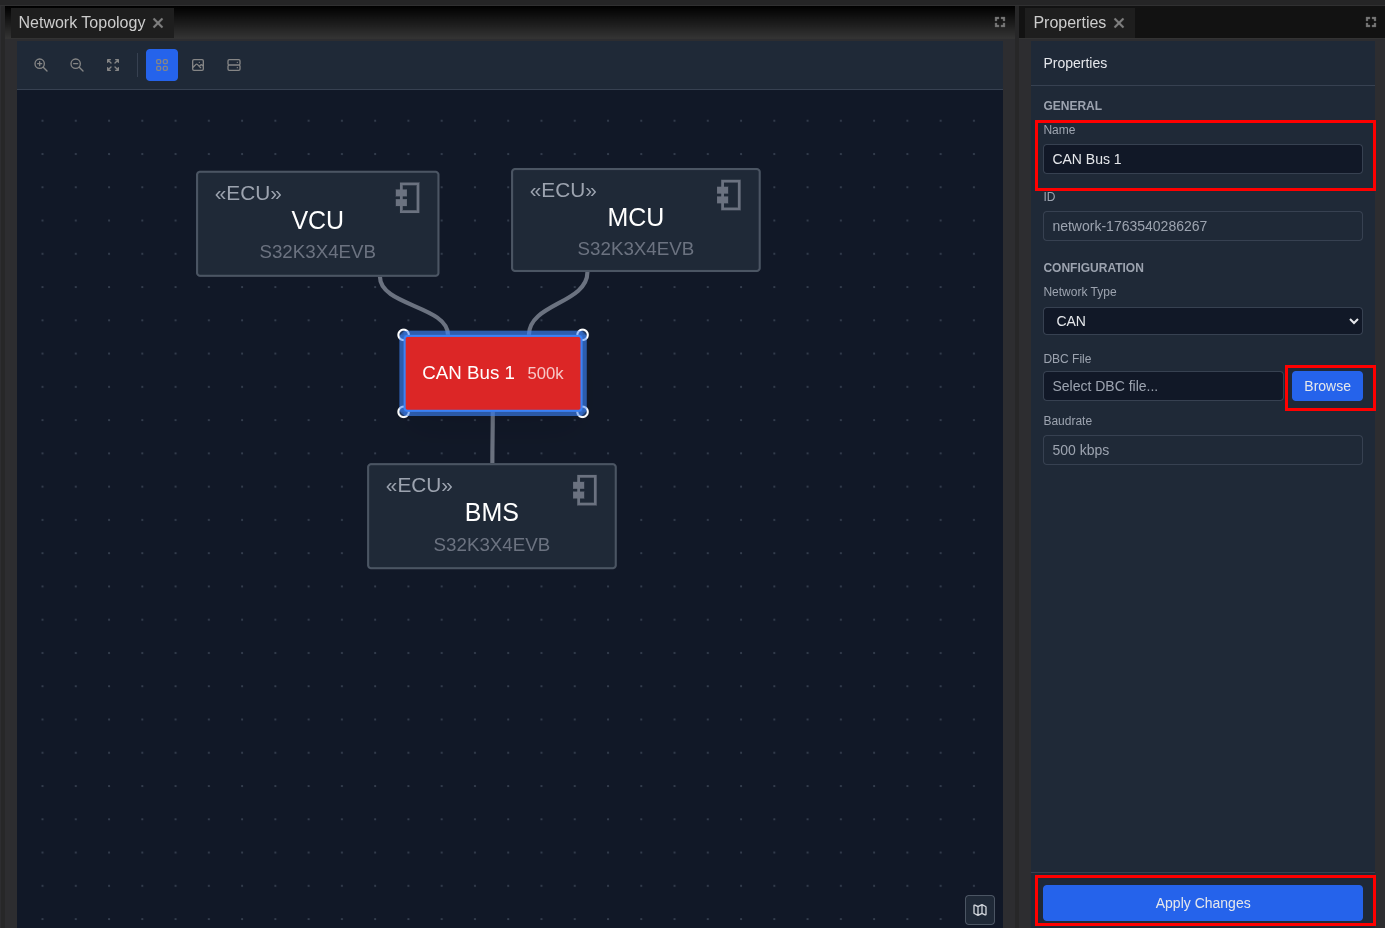
- Verify or add a CAN network:
- From the Toolbox, drag a CAN Bus to the canvas (if not present)
- Select the CAN bus
- In Properties panel:
- Name:
CAN Bus 1 - Baud Rate:
500000 - DBC File: Browse and select
DBC.dbc - Click Apply Changes
- Name:
- Add ECUs for the analysis (if creating new):
- Drag three ECUs from the Toolbox
- Configure as VCU, MCU, and BMS
- Board:
S32K3X4EVB, OS:Zephyr -
Connect all to the CAN bus
-
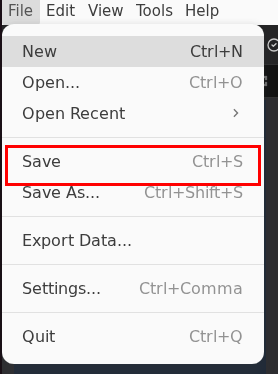
Save the system:
- Click File → Save
- File saves as
truefidelity-system.json
Step 2: Start the System
Deploy the system to enable playback functionality.
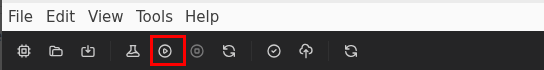
- Start the system:
- Click the Start button (green play icon) in the toolbar
- Wait for ECUs to reach "Running" state
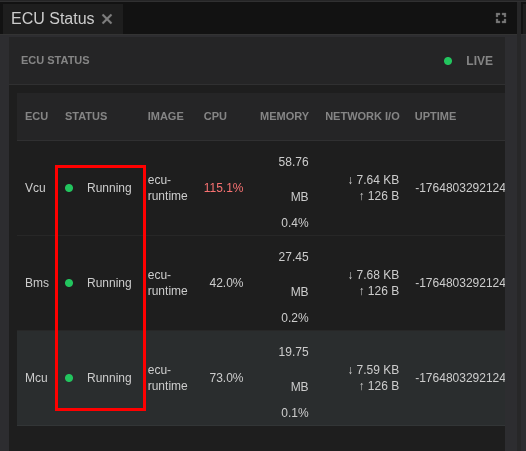
- Verify system is running:
- Check ECU Status panel shows all ECUs as "Running"
- Status bar shows container count (e.g., "3 / 3 Containers Running")
Part 2: CAN Log Analysis Setup
Step 3: Switch to CAN Log Analysis Mode
Configure the workspace for signal analysis.
- Change to analysis mode:
- Click View → Layouts → Network Analysis
-
The layout reconfigures automatically
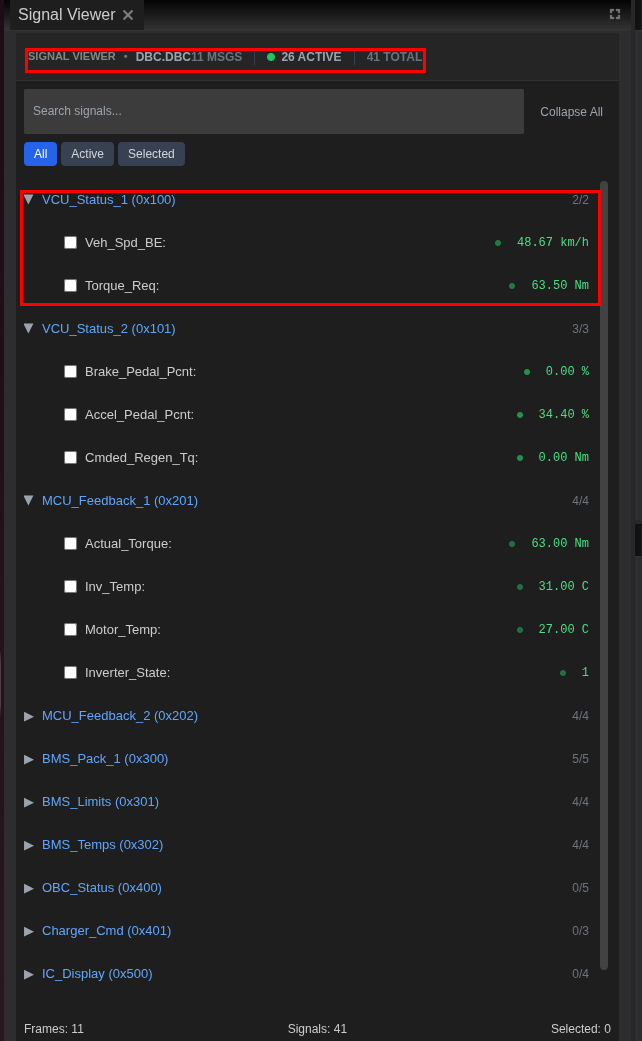
-
Understand the analysis layout:
- Signal Viewer (left): Hierarchical signal tree from DBC
- Network Traffic (center): Live CAN frames
- Signal Chart (right): Time-series visualization
- Signal Player & Injection (bottom): Playback and injection controls
- Adjust panel sizes if needed:
- Drag panel borders to resize
- Maximize Signal Chart for better visibility
- Ensure Signal Player is fully visible
Step 4: Load the BLF Log File
Import the captured data for analysis.
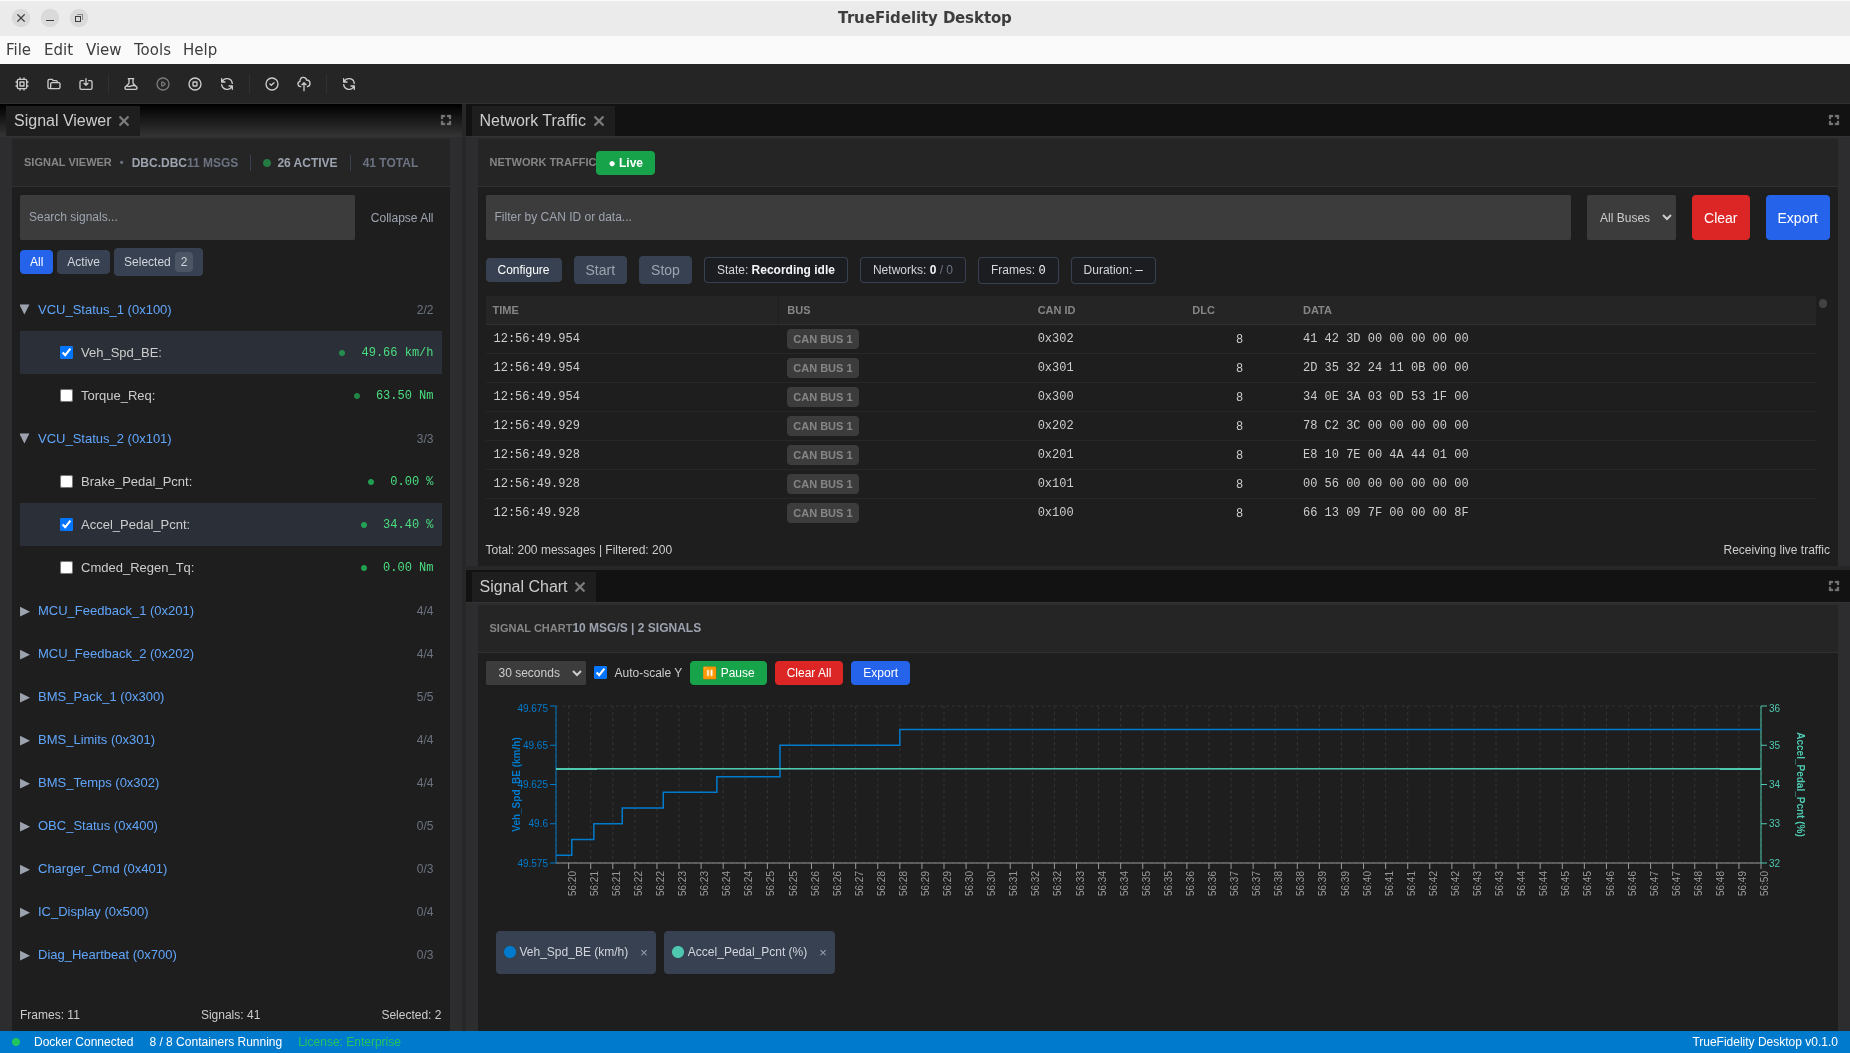
- Open Signal Player panel:
- Located at the bottom of the screen
-
If not visible: View → Panels → Signal Player & Injection
-
Load the BLF file:
- Click Select BLF button
- Navigate to your log file (e.g.,
regen_test_drive.blf) - Click Open
- Inspect the loaded data:
- Click Inspect bundle to view details:
- File size and duration
- Number of CAN frames
- Detected channels
- Average data rate
-
Verify the log loaded correctly
-
Check DBC association:
- The Networks section shows
CAN Bus 1 - Confirms DBC file is linked
- Signals will be decoded during playback
Step 5: Configure Playback Settings
Prepare for optimal playback performance.
- Verify playback readiness:
- System must be running (toolbar shows Stop button)
- Signal Player shows Play button enabled
-
BLF file successfully loaded
-
Prepare monitoring panels:
- Clear Network Traffic with the Clear button
- Position panels for comfortable viewing
- Signal Viewer ready for navigation
Part 3: Signal Identification and Selection
Step 6: Locate Regenerative Braking Signals
Find the relevant signals for regen analysis from the DBC file.
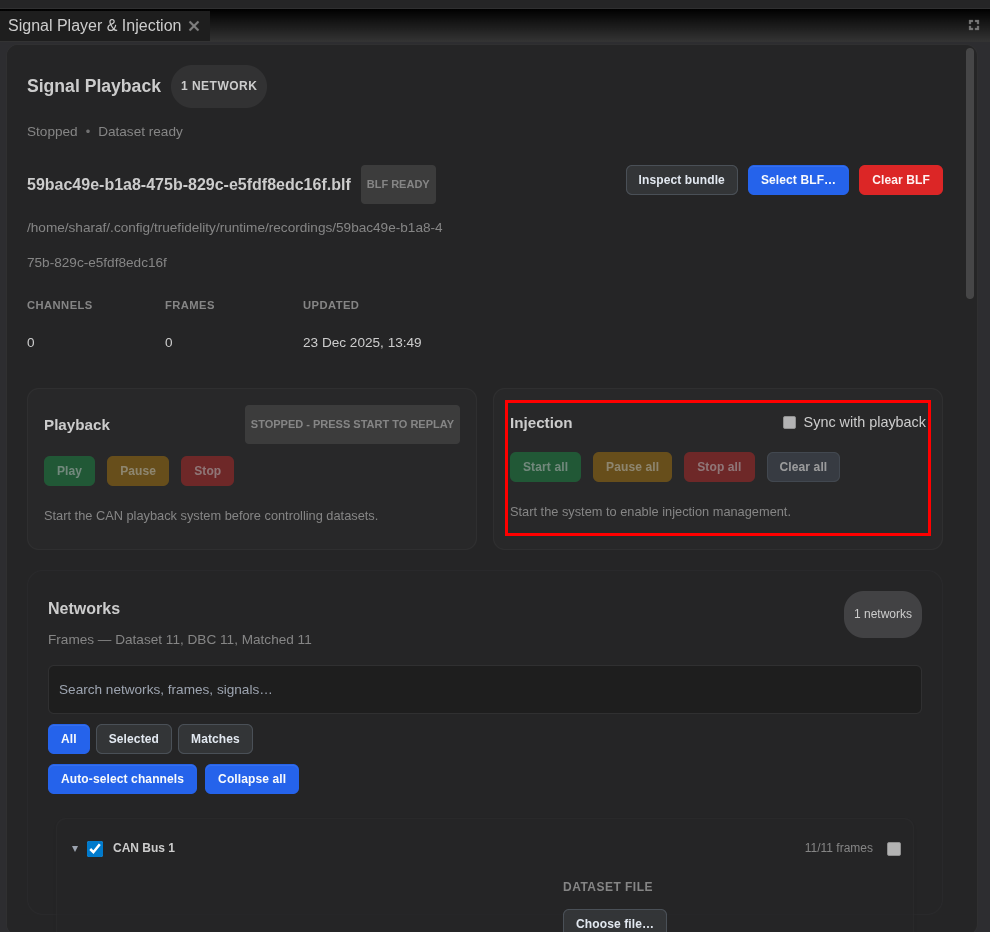
- Open Signal Viewer:
- Click on the Signal Viewer panel (left)
-
Shows all signals from the DBC file organized by CAN message
-
Search for motor signals:
- Use the search box at top
- Enter "Motor" or "Torque" to find motor-related signals
-
Results filter as you type
-
Identify key signals for regen analysis:
From MCU_Feedback_1 (0x201):
- Motor_Spd: Motor speed in rpm
- Actual_Torque: Delivered torque in Nm (negative during regen)
- Motor_Temp: Motor temperature in °C
- Inverter_State: Current inverter operating state
From MCU_Feedback_2 (0x202):
- DC_Link_V: DC bus voltage
- Phase_Curr_RMS: Motor phase current
- Regen_Active: Regeneration active flag (0/1)
From VCU_Status_2 (0x101):
- Brake_Pedal_Pcnt: Brake pedal position (%)
- Cmded_Regen_Tq: Commanded regenerative torque
From BMS_Pack_1 (0x300):
- Pack_V: Battery pack voltage
- Pack_I: Battery current (negative = charging/regen)
- SOC: State of charge percentage
- Expand signal details:
- Click arrows next to CAN frames to expand
- View signal properties:
- Signal name and units
- Min/max values
- Scaling factors
- Current value (during playback)
Step 7: Select Signals for Monitoring
Choose signals to chart and analyze.
- Select primary regen signals:
- Check the box next to
Actual_Torque(MCU_Feedback_1) - Select
Regen_Active(MCU_Feedback_2) - Select
Pack_I(BMS_Pack_1) -
These will appear in the Signal Chart
-
Add supporting signals:
Motor_Spd: For speed contextBrake_Pedal_Pcnt: To correlate with driver input-
Cmded_Regen_Tq: To compare command vs actual -
Clear search to see all signals:
- Remove search text
- Full signal tree returns
- Selected signals remain checked
Part 4: Playback and Analysis
Step 8: Start Playback
Begin replaying the captured data.
- Start playback:
- In Signal Player, click Play button
- Playback begins from the start
-
Progress bar shows current position
-
Monitor Network Traffic:
- CAN frames appear in real-time
- Observe frame rate and timing
- Each frame shows:
- Timestamp
- CAN ID (hex)
- Data bytes
- Frame counter

- Watch Signal Viewer:
- Selected signals show live values
- Values update as frames arrive
-
Green dots indicate active signals
-
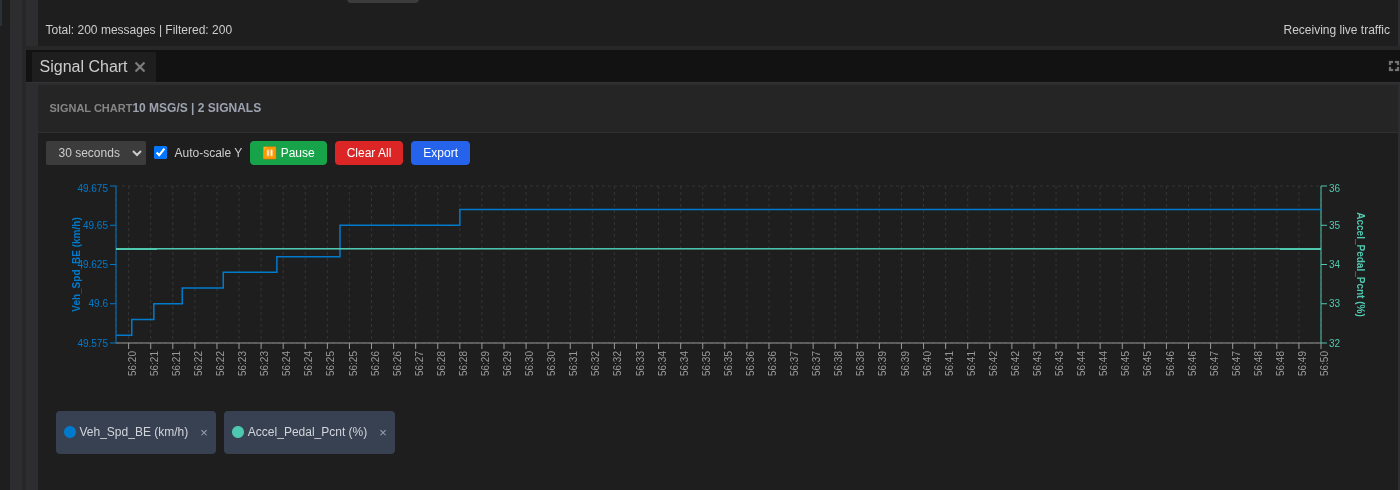
Observe Signal Chart:
- Lines plot in real-time
- Each signal has unique color
- Time axis scrolls automatically
Step 9: Identify Regen Anomalies
Look for unusual patterns in regenerative braking behavior.
- Monitor regen activation:
- Watch
Regen_Activesignal transitions (0→1→0) - Should correlate with
Brake_Pedal_Pcntincreases -
Note any delays or mismatches
-
Analyze torque behavior:
- Compare
Cmded_Regen_TqwithActual_Torque - They should track closely during regen
-
Look for:
- Command without response
- Delayed torque delivery
- Torque oscillations
-
Check battery current:
Pack_Ishould go negative during regen (charging)- Magnitude should correlate with
Actual_Torque -
Look for:
- Current spikes
- Unexpected direction changes
- Zero current during active regen
-
Identify problem areas:
When you spot an anomaly: - Click Pause in Signal Player - Note the timestamp - Observe all signal values - Document the pattern: - Regen commanded but no torque delivered - Torque delivered but no battery current - Oscillations in torque or current
Step 10: Detailed Investigation
Zoom into problem areas for closer analysis.
- Navigate to specific timestamp:
- Use Signal Player progress bar
- Click and drag to scrub through log
-
Position at the start of an anomaly
-
Adjust playback speed:
- Slow to 0.5x for detailed observation
- Speed up to 2x for quick scanning
-
Pause frequently to examine details
-
Focus on anomaly window:
- Identify start of anomaly
- Play through event slowly
- Identify end of anomaly
-
Note total duration
-
Chart analysis:
In Signal Chart panel: - Time Window: Adjust to 30 seconds for detail - Auto-scale: Enable for best fit - Zoom with mouse wheel on time axis - Click and drag to pan
Step 11: Filter Network Traffic
Focus on specific messages during analysis.
- Apply CAN ID filter:
- In Network Traffic panel
- Enter CAN ID in filter field
- Example:
0x201for MCU_Feedback_1 -
Only matching frames are shown
-
Filter by multiple IDs:
- Filter for
0x201(MCU feedback) - Or
0x300(BMS status) -
Helps isolate specific subsystem messages
-
Clear filters when done:
- Click Clear or remove filter text
- Returns to full traffic view
- Helps see context again
Part 5: Quantitative Analysis
Step 12: Measure Regen Performance
Quantify the regenerative braking behavior.
- Identify regen events:
- Pause at each
Regen_Activetransition (0→1) - Record the brake pedal percentage
- Note the commanded regen torque
-
Measure the actual torque delivered
-
Calculate efficiency:
- Compare
Cmded_Regen_TqvsActual_Torque - Note any gaps or delays
-
Measure response time (command to delivery)
-
Create event summary:
Example findings: ``` Event 1: Timestamp 00:02:15 - Brake Pedal: 25% - Commanded Regen Torque: -150 Nm - Actual Torque: -145 Nm (97% efficiency) - Pack Current: -45 A - Response time: ~50ms - Status: Normal
Event 2: Timestamp 00:05:42 - Brake Pedal: 40% - Commanded Regen Torque: -250 Nm - Actual Torque: -180 Nm (72% efficiency) - Pack Current: -52 A - Response time: ~150ms - Status: ANOMALY - Torque limited ```
Step 13: Pattern Analysis
Identify recurring issues or triggers.
- Look for patterns:
- Do anomalies occur at specific SOC levels?
- Any correlation with motor temperature?
- Related to vehicle speed (Motor_Spd)?
-
Battery temperature (Cell_Tmax) factor?
-
Check BMS limits:
- Review
Max_Charge_PwrandMax_Charge_Tqfrom BMS_Limits - Does regen get limited when battery is near full?
-
Temperature-related derating?
-
System behavior:
- Does issue self-recover?
- Any correlation with
Inverter_Statechanges? - Pattern repetition frequency?
Part 6: Data Export
Step 14: Export Network Traffic
Save raw CAN data for detailed analysis.
- Stop playback:
- Click Stop in Signal Player
-
Ensures complete data in buffer
-
Export from Network Traffic:
- Click Export button in toolbar
- Choose format:
- Text (.txt): Human-readable
- CSV (.csv): For spreadsheet analysis
- JSON (.json): For programmatic processing
- candump: Standard CAN log format
- Name:
regen_analysis_traffic.csv -
Click Save
-
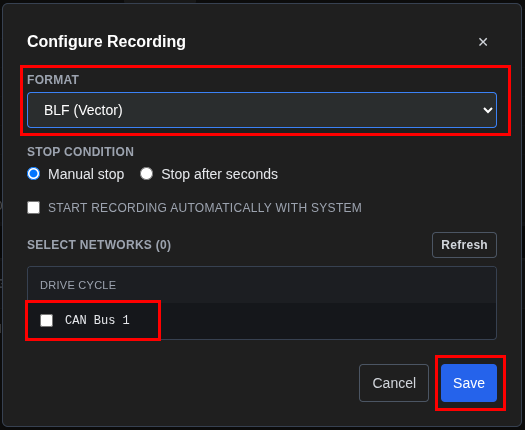
Capture to industry formats (for longer recordings):
- Click Configure in Network Traffic toolbar
- Select network/channel
- Choose format: BLF (Vector), MDF4, or CSV
- Click Start Capture, then Stop Capture when done
Step 15: Export Signal Data
Save decoded signal values for analysis.
- Prepare for export:
- Ensure relevant signals are selected in Signal Viewer
- Playback includes the anomaly timeframe
-
Chart shows complete events of interest
-
Export signal values:
- Focus on critical signals: Actual_Torque, Pack_I, Regen_Active
- Include time range of interest
- Decoded values with proper units
-
Save as:
regen_signals_decoded.csv -
Export contents include:
- Timestamp column
- Selected signal columns
- Proper scaling applied (from DBC)
- Engineering units
Step 16: Export Visualizations
Capture charts for documentation.
- Configure Signal Chart:
- Adjust time window to show anomaly clearly
- Ensure all relevant signals visible
- Enable grid for measurement reference
-
Verify legend shows signal names
-
Export chart:
- Right-click on Signal Chart
- Select Export Chart
- Choose format (PNG recommended)
-
Name:
regen_torque_anomaly.png -
Additional screenshots:
- Network Traffic during anomaly
- Signal Viewer with peak values
- Save for report inclusion
Part 7: Documentation
Step 17: Create Analysis Report
Document findings for the engineering team.
- Compile findings document:
``` Regenerative Braking Analysis Report ==================================== Date: [Current Date] Analyst: [Your Name] Log File: regen_test_drive.blf Duration: 15 minutes System: Drive Cycle (VCU, MCU, BMS)
Summary: Identified 4 regen torque limitation events where actual torque was significantly below commanded value.
Key Findings:
-
Event at 00:05:42
- Commanded: -250 Nm, Actual: -180 Nm
- SOC at time: 85%
- BMS Max_Charge_Tq: 180 Nm (limiting factor)
- Root cause: BMS limiting regen near full charge
-
Event at 00:08:15
- Commanded: -200 Nm, Actual: -120 Nm
- Motor_Temp: 78°C
- Inverter derating suspected
- Correlation with Inv_Temp increase
-
Event at 00:11:30
- Commanded: -180 Nm, Actual: -50 Nm
- Cell_Tmax: 42°C
- BMS thermal protection active
- Heater_On = 0 (cooling needed)
Analysis: - Regen limiting primarily driven by BMS constraints - High SOC (>80%) triggers charge power limits - Thermal conditions affect both MCU and BMS limits - VCU should pre-calculate available regen based on limits
Recommendations: - Review VCU regen request logic vs BMS limits - Implement predictive regen calculation - Improve thermal management during sustained regen - Consider driver feedback for limited regen scenarios ```
- Attach supporting data:
- Exported CSV files
- Chart screenshots
-
Network traffic logs
-
Organize deliverables:
RegenAnalysis/
   ├── truefidelity-system.json
   ├── exports/
   │   ├── regen_analysis_traffic.csv
   │   ├── regen_signals_decoded.csv
   │   └── regen_torque_anomaly.png
   ├── logs/
   │   └── regen_test_drive.blf
   └── reports/
       └── regen_analysis_report.md
Troubleshooting Guide
Common Playback Issues
BLF File Won't Load
Symptom: Select BLF fails or shows error
Solutions: 1. Check file isn't corrupted 2. Verify file size is manageable (<2GB recommended) 3. Ensure sufficient memory available 4. Check file permissions 5. Try a different BLF file to isolate issue
No Signals Appearing
Symptom: Signal Viewer empty during playback
Solutions: 1. Verify DBC file is loaded in network properties 2. Check DBC CAN IDs match the log file 3. Ensure network is properly configured 4. Reload the system after DBC changes
Playback Stutters or Freezes
Symptom: Playback isn't smooth
Solutions: 1. Reduce number of charted signals (3-5 recommended) 2. Close unnecessary panels 3. Clear Network Traffic periodically 4. Reduce chart time window 5. Close other applications
Signal Values Don't Update
Symptom: Values stay at zero or don't change
Solutions: 1. Verify playback is actually running (progress bar moving) 2. Check signal selection in Signal Viewer 3. Ensure DBC scaling is correct 4. Verify signal exists in the log (check Network Traffic)
Chart Not Displaying
Symptom: Signal Chart remains empty
Solutions: 1. Select signals first in Signal Viewer (checkboxes) 2. Ensure playback has started 3. Check time window settings 4. Enable Auto-scale 5. Verify signals are receiving data
Performance Optimization
For Large Log Files
- Memory management:
- Close unused panels
- Limit selected signals to essentials
- Clear Network Traffic regularly
-
Export in time segments
-
Playback optimization:
- Start with fewer signals, add gradually
- Use filtering extensively
- Disable auto-scroll in Network Traffic
For Complex Analysis
- Workflow optimization:
- Pre-filter in Network Traffic
- Focus on specific time ranges
- Export incrementally
-
Document findings as you go
-
Signal management:
- Group related signals (all MCU, all BMS)
- Use consistent time windows
- Clear unneeded selections
Advanced Techniques
Multi-Stage Analysis
- Initial scan (2x-4x speed):
- Identify regions of interest
- Note approximate timestamps
-
Get overall patterns
-
Detailed review (0.5x-1x speed):
- Focus on problem areas
- Precise measurements
-
Correlation analysis
-
Verification (1x speed):
- Confirm findings
- Check edge cases
- Validate patterns
Signal Correlation
- Identify relationships:
- Command vs feedback:
Cmded_Regen_TqvsActual_Torque - Cause and effect:
Brake_Pedal_Pcnt→Regen_Active→Pack_I -
Limiting factors:
Max_Charge_TqvsActual_Torque -
Timing analysis:
- Measure response delays (command to action)
- Identify synchronization issues
- Check message periodicity
Integration with External Tools
Python Analysis
import pandas as pd
import matplotlib.pyplot as plt

# Load exported data
df = pd.read_csv('regen_signals_decoded.csv')

# Find regen events
regen_events = df[df['Regen_Active'] == 1]

# Calculate efficiency
df['Regen_Efficiency'] = df['Actual_Torque'] / df['Cmded_Regen_Tq'] * 100

# Plot torque comparison
plt.figure(figsize=(12, 6))
plt.plot(df['Timestamp'], df['Cmded_Regen_Tq'], label='Commanded')
plt.plot(df['Timestamp'], df['Actual_Torque'], label='Actual')
plt.xlabel('Time (s)')
plt.ylabel('Torque (Nm)')
plt.legend()
plt.title('Regen Torque: Command vs Actual')
plt.show()
MATLAB Analysis
% Load exported data
data = readtable('regen_signals_decoded.csv');

% Plot regen analysis
figure;
subplot(3,1,1);
plot(data.Timestamp, data.Actual_Torque);
ylabel('Torque (Nm)');
title('Regenerative Braking Analysis');

subplot(3,1,2);
plot(data.Timestamp, data.Pack_I);
ylabel('Current (A)');

subplot(3,1,3);
plot(data.Timestamp, data.Regen_Active);
ylabel('Regen Active');
xlabel('Time (s)');
Summary
You've completed a comprehensive playback analysis workflow:
- ✅ Configured system with CAN network and DBC
- ✅ Loaded and inspected BLF log file
- ✅ Identified and selected relevant EV signals
- ✅ Performed real-time playback analysis
- ✅ Located and quantified regen anomalies
- ✅ Filtered network traffic for focus
- ✅ Exported data for external analysis
- ✅ Created comprehensive documentation
This tutorial covered essential skills for analyzing CAN logs in TrueFidelity. The techniques apply to various EV debugging scenarios, from regenerative braking issues to battery management troubleshooting.
Next Steps
- Practice with different logs:
- Analyze charging scenarios
- Debug motor control issues
-
Investigate battery anomalies
-
Expand your analysis:
- Add more signal correlations
- Develop pattern recognition skills
-
Create reusable analysis workflows
-
Advanced topics:
- Signal injection testing (see End-to-End Example)
- GDB debugging for firmware issues
- Multi-bus analysis
Related Tutorials
- System Design Workflow: Building ECU topologies
- ECU Monitoring Walkthrough: Real-time system monitoring
- End-to-End Example: Complete analysis with injection testing
- DBC & Signal Definitions: Working with signal databases